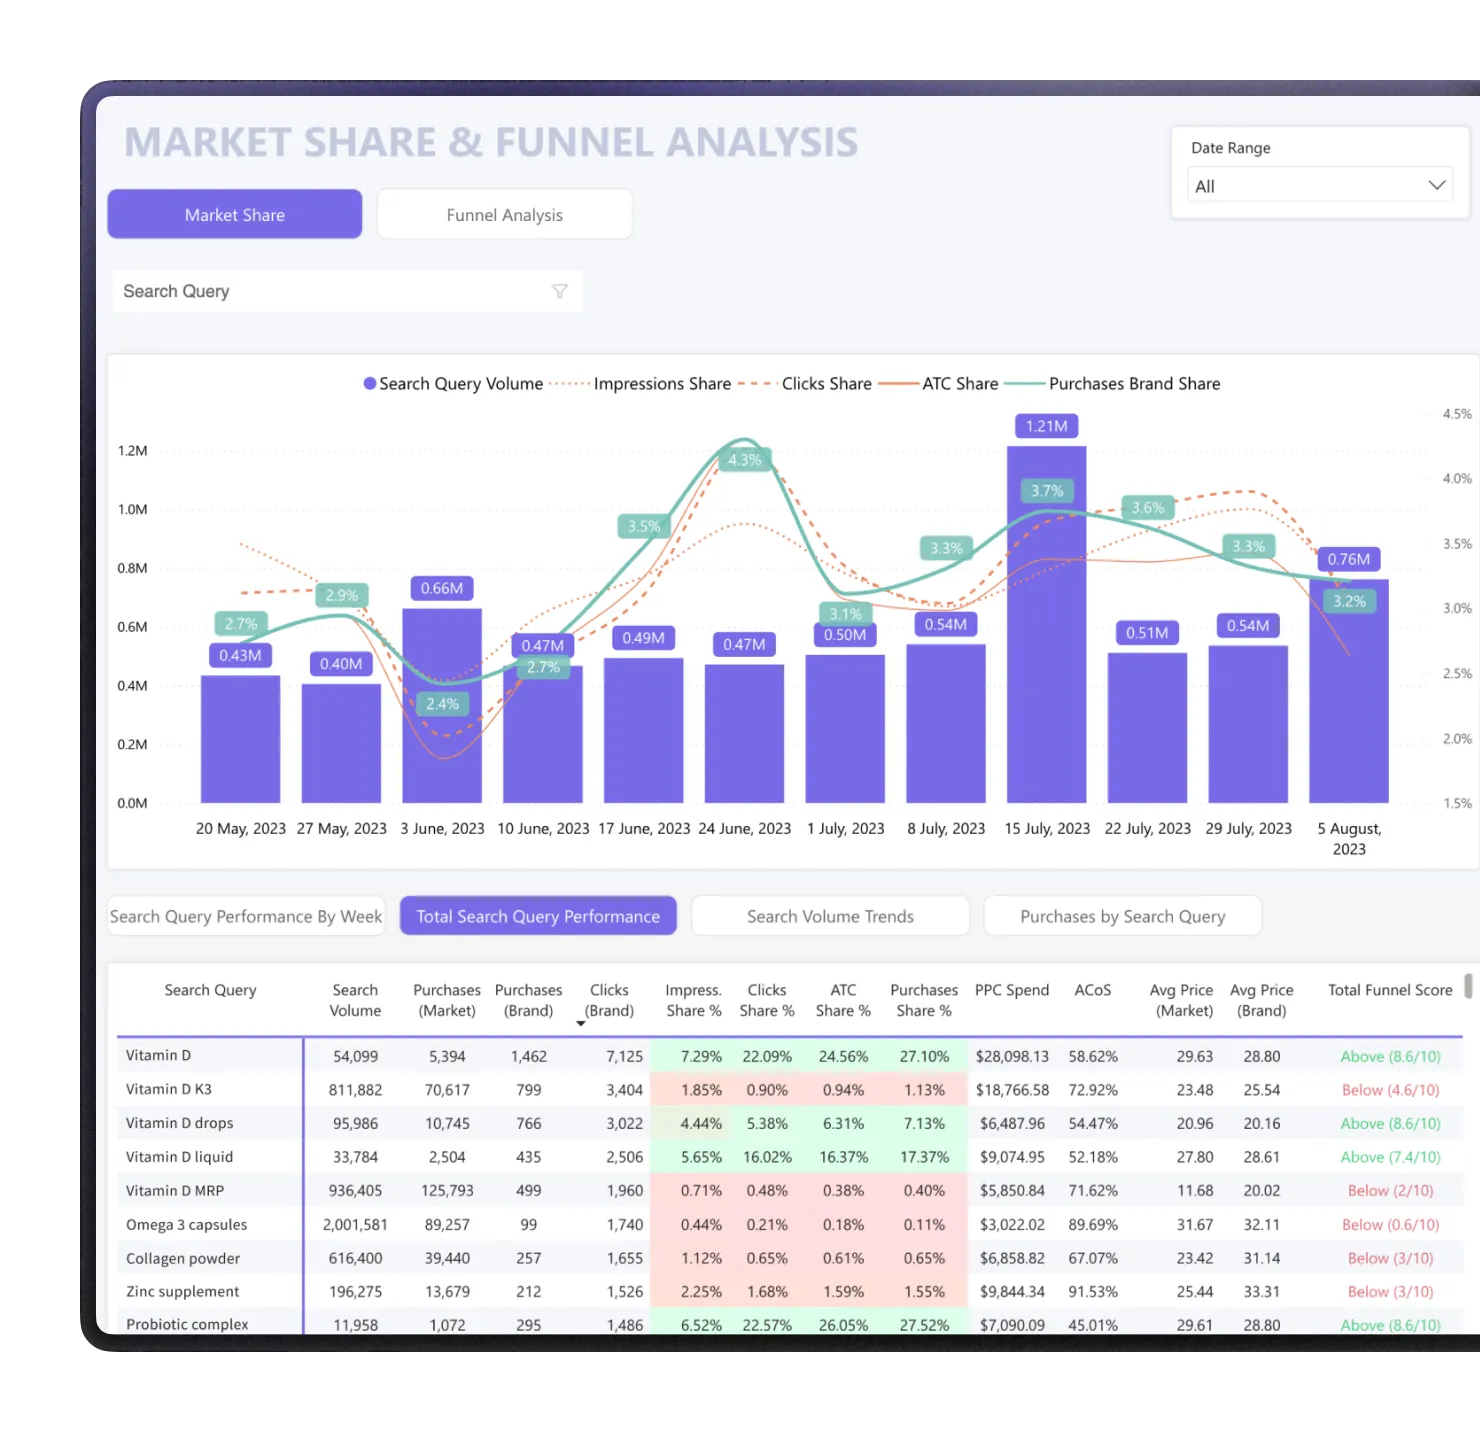
- For durable goods sellersComprehensive analytics for every part of your Amazon business — from essential profit tracking to advanced insights like PPC by hour and keyword-level market share.

 For CPG brandsAll reports are built for repeat-purchase brands. Track P&L by New-to-Brand vs. Repeat, monitor Subscribe & Save, LTV, and cohorts — with 12+ CPG-optimized reports to help your brand grow.
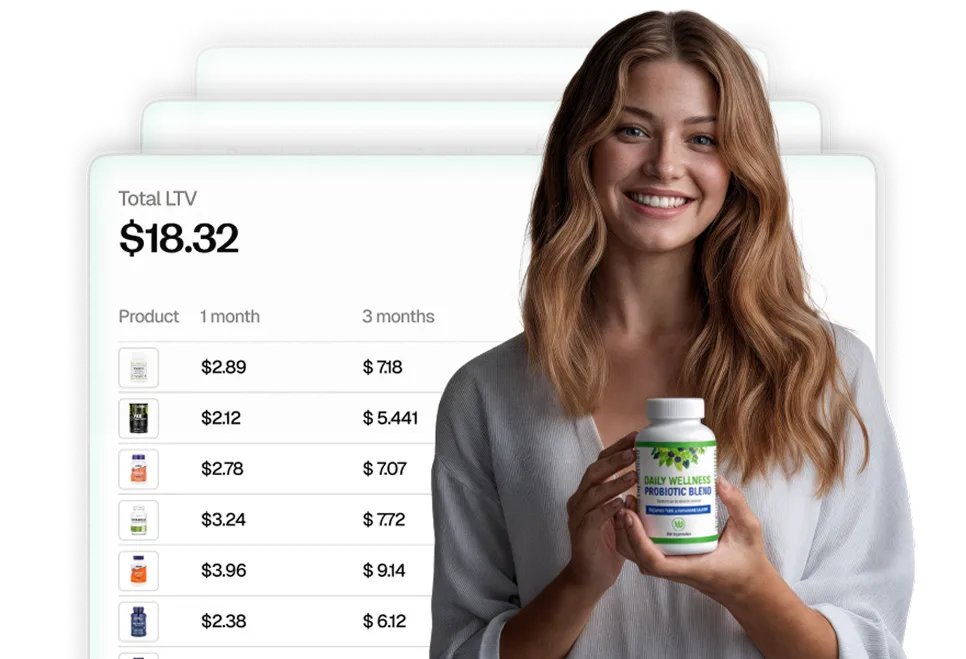
 For agenciesDo all your internal analytics and client reporting in one place. Build reports that look exactly like the ones your clients know — or design something completely new.
 CustomizationBuild dashboards that match how your team works — tailored KPIs, workflows that empower your business.
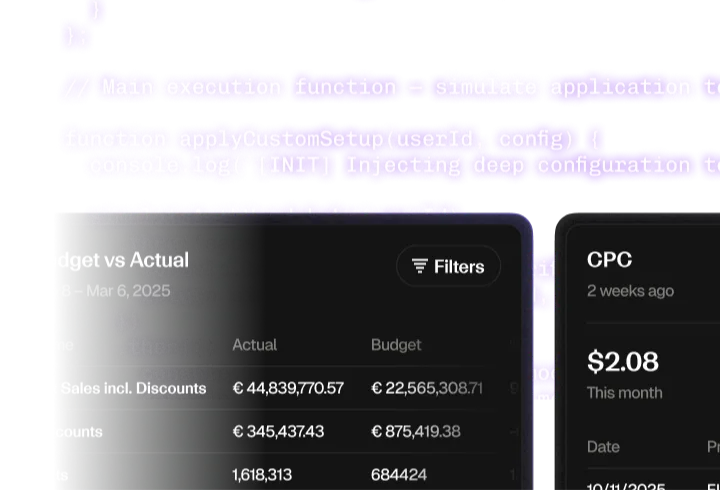

- Pricing