We’re part of:
Trusted by
industry leaders
100%
NTB accuracy
3×
Faster Insights
2×
Subscriber Growth
40%
NTB increase
100%
Auto Reporting
50hrs+
Saved
-18%
Wasted ad spend
10x
Decision Speed
5hrs+
Saved Daily
100%
Profit Clarity
3×
Optimization
100%
Branded view
100%
Centralized Data
5×
Reporting Speed
+13%
Gross margin
−22%
Refund reduction
4×
Efficiency Gain
100%
Cost Control
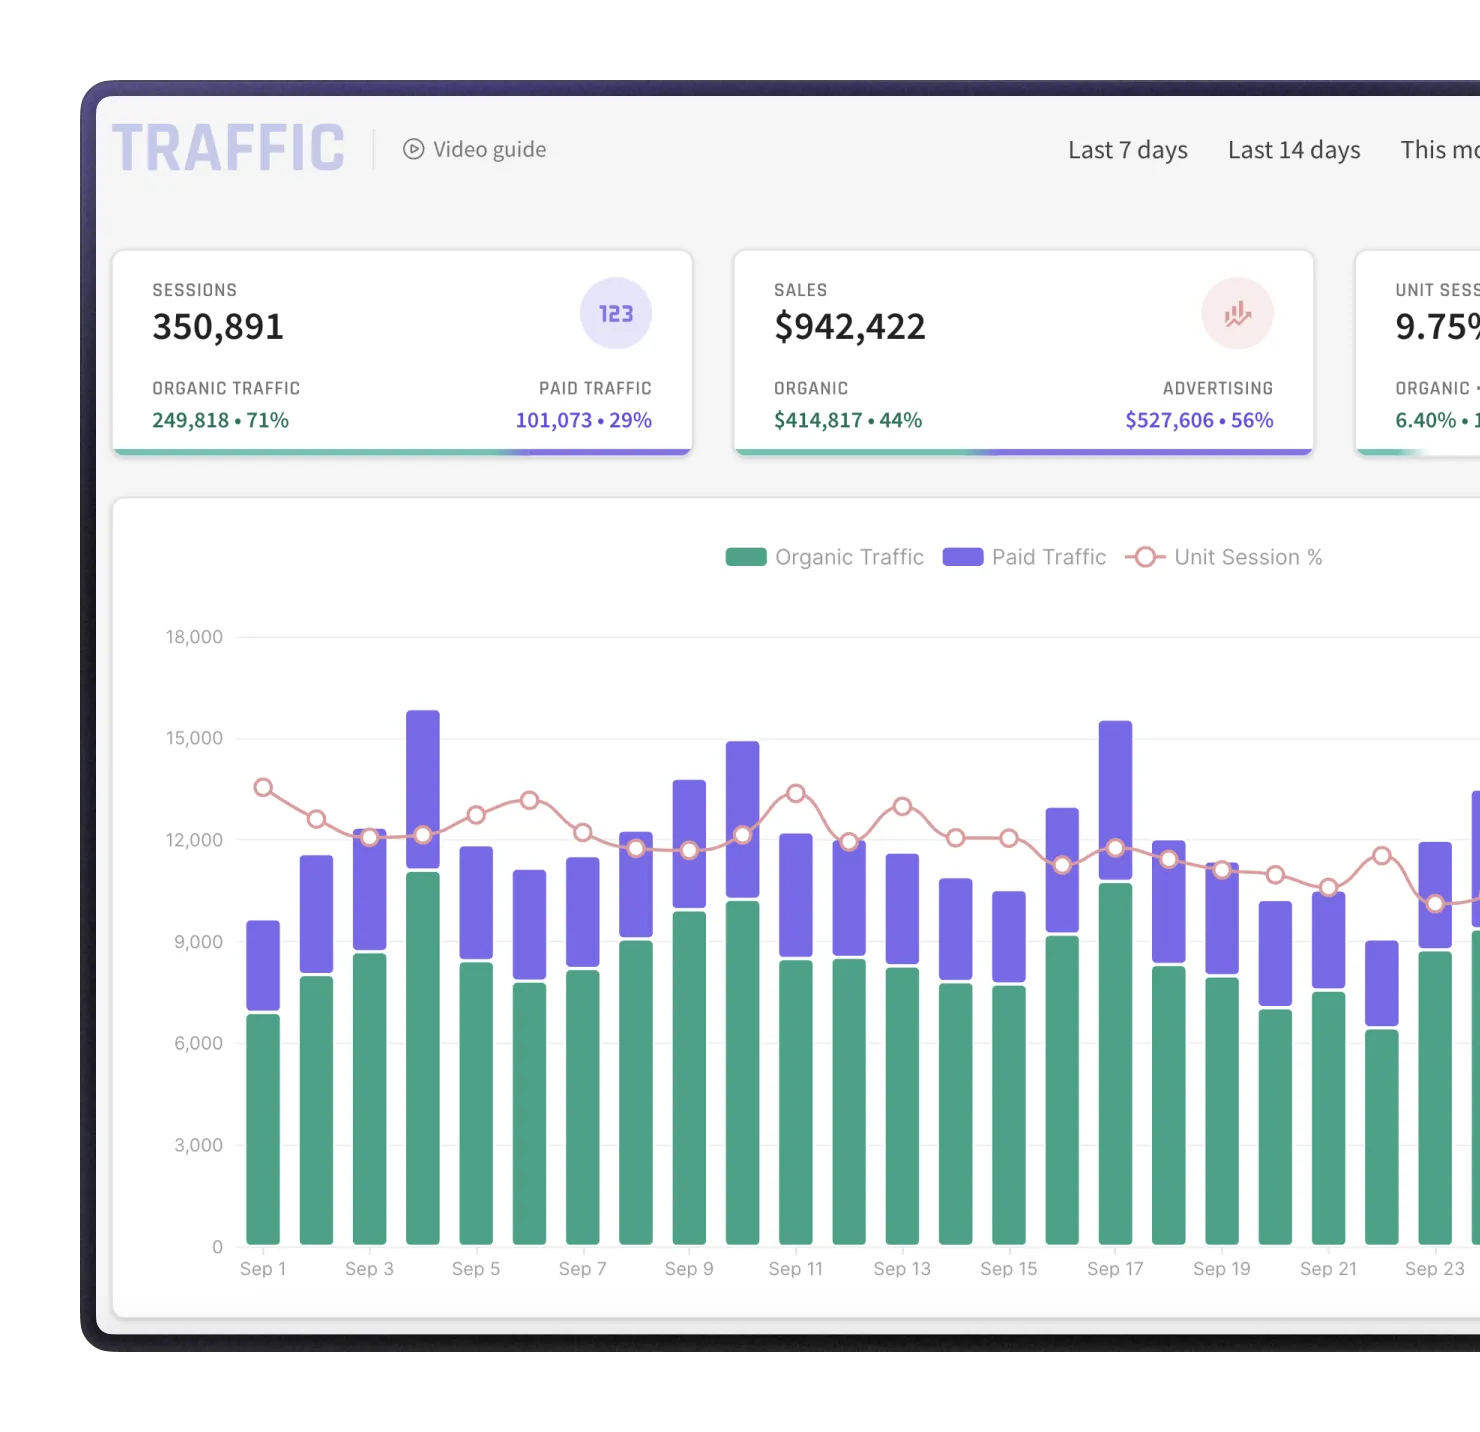
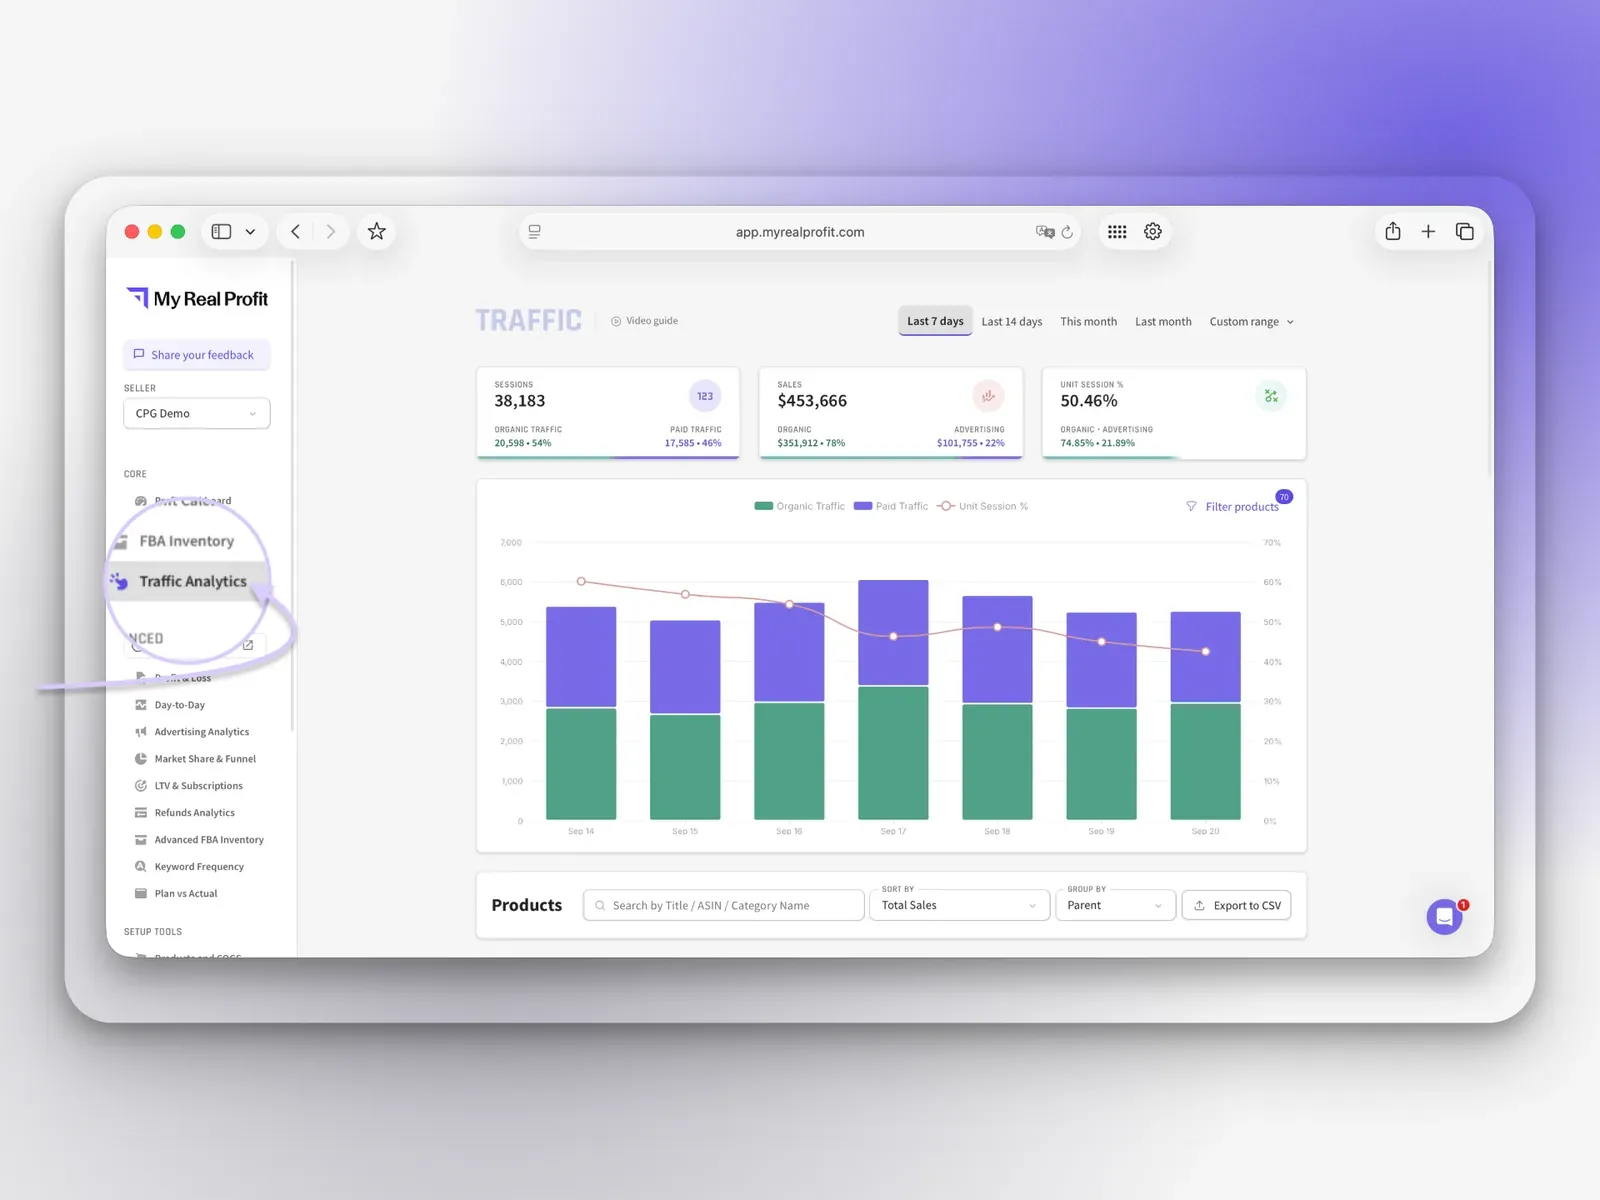
Amazon traffic analytics inside MyRealProfit is the Traffic Analytics report: one view that splits your sessions into organic traffic and paid traffic, and puts conversion next to them.
Seller Central gives you total sessions. A total hides the reason behind the change. Sessions can grow because ad clicks grew while organic visibility fell. Conversion can drop because a bigger share of your traffic now comes from ads.
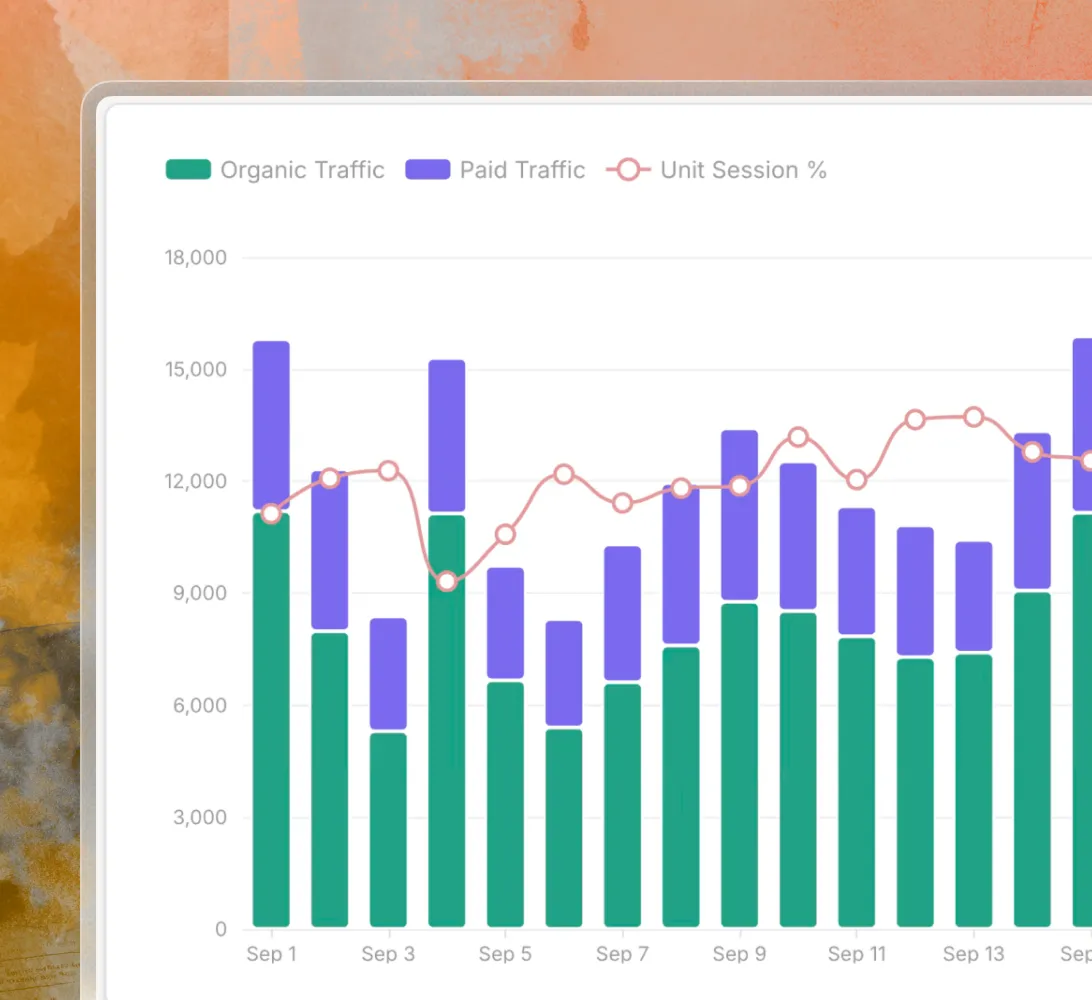
The report separates those two streams, so you see which one moved and what conversion did at the same time.

Sessions, Organic Traffic, and Paid Traffic sit in the same view with their share in percent.
So you can tell whether growth came from stronger organic visibility or from more ad spend.
Unit Session % is shown on the same chart as the traffic bars.
If sessions hold steady and Unit Session % falls, the problem is the listing, the price, or the offer, not traffic volume.
Group the data by parent, child, category, or account.
One child ASIN losing traffic is a listing problem. A whole category losing sessions is demand or seasonality.
Traffic Analytics is one report inside a full analytics platform. Alongside it, MyRealProfit gives you:
See what your traffic earns: a full Amazon profit and loss statement with fees, refunds, VAT, and COGS already removed.
Check all core Amazon KPIs in one heat-map table when you need context beyond traffic and conversion.
Follow your paid traffic further: advertising analytics down to hourly detail for the days when TACoS or ACoS moves.
Know what a buyer brings: customer lifetime value over a full year, not only the first order, plus Subscribe & Save retention.
Your search query market share by impressions, clicks, ATCs, and purchases, so you catch a keyword losing share before your sessions drop.
Understand why customers return and what your refund rate takes out of your margin.
MyRealProfit reads your data through the official SP-API and Advertising API, updates automatically, and only reads data, so it never changes your listings or prices.
Here is the full flow, from sign-up to your first profit view.
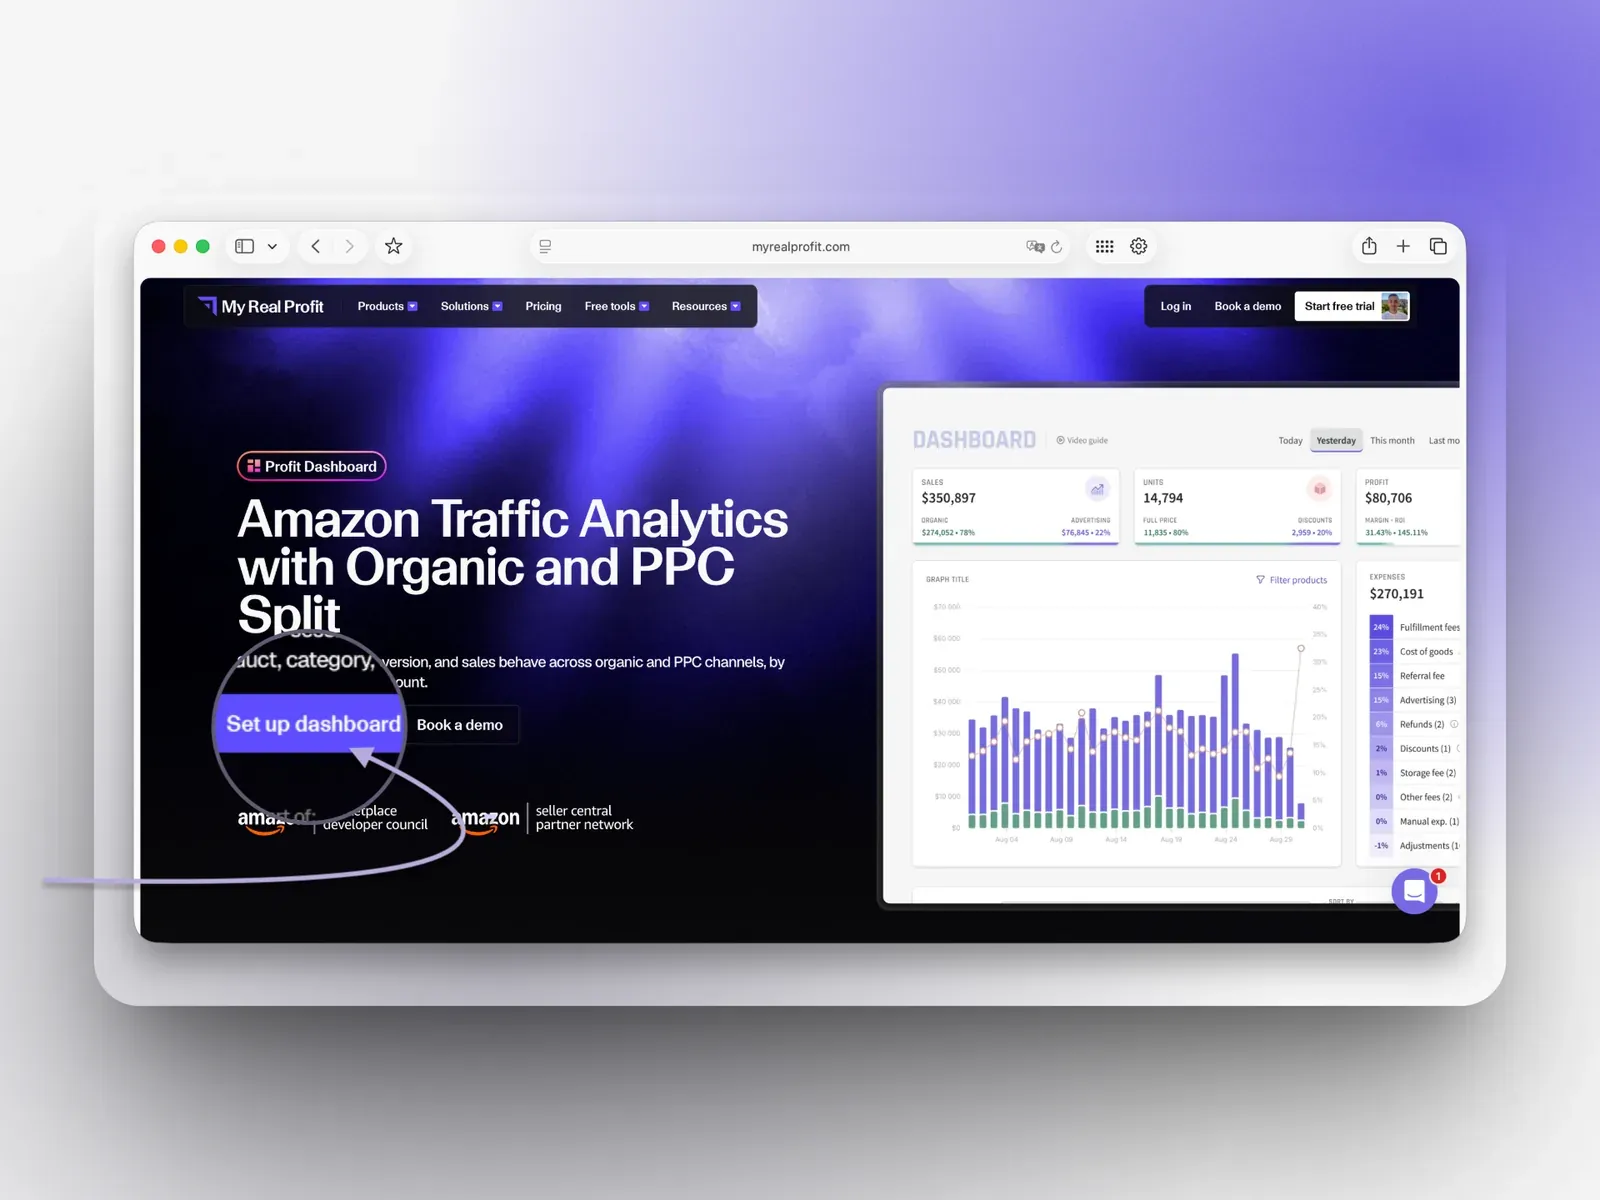
Click the 'Set up dashboard' button at the top of the page, fill in the form, and click 'Start 21-day free trial'. No credit card is required.
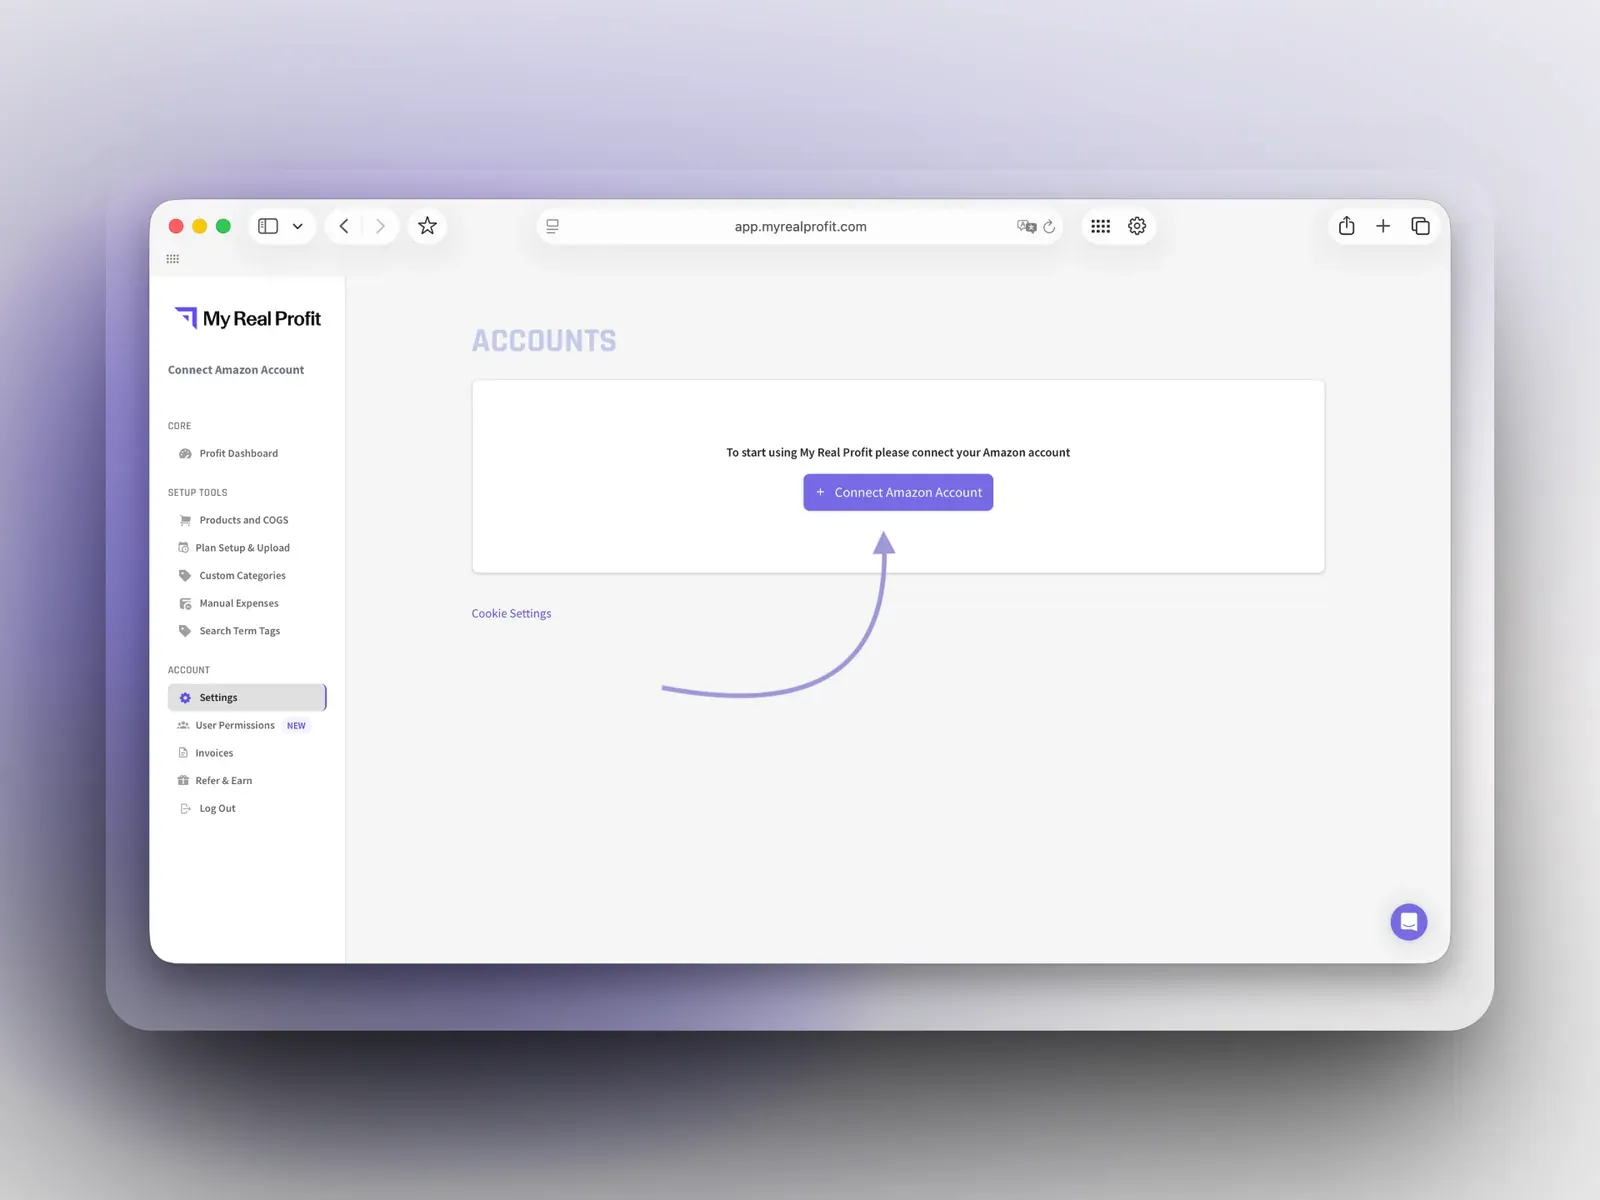
Click 'Connect Amazon Account' and pick your region (North America, Europe, or Far East). Then connect your Advertising account so paid traffic is included. This takes under five minutes.
Your data imports automatically. In the left menu, click Traffic Analytics. This is your Amazon traffic analytics view.
See it in the video below. In the walkthrough you can:
Check whether a sales change came from traffic, conversion, or ads, before touching bids or prices.
See how much of your traffic advertising actually buys, and what it does to conversion.
Watch organic visibility per ASIN while ad spend moves up and down.
Give every client the same organic versus paid read, without rebuilding a report each time.
Total sessions tell you that something changed. They do not tell you what. Amazon traffic analytics inside MyRealProfit splits every session into organic and paid, puts conversion beside it, and lets you move from account level down to a single child ASIN. Connect your account, wait for the data to load, and stop guessing which half of your traffic moved. MyRealProfit has a 21-day free trial, and no credit card is required.
Book a free demo call or start your free trial today and see
exactly how it works for your business.