


June 28, 2023 ● 9 min read
Amazon Seller Reports Guide: All Reports Explained With Links


For experienced Amazon sellers, success is tightly connected to their ability to make sense of numbers. Sales, returns, clicks, search queries, restock alerts—all of this lives in Seller Central, but extracting actionable insights isn’t always intuitive.
Many sellers rely heavily on guesswork or third-party tools without fully understanding how to leverage the original data from Amazon itself. That’s a missed opportunity.
This guide is designed to help you take full control of your analytics by walking you through the five core categories of Seller Central reports:
Advertising Analytics
Financial Analytics
Sales Analytics
Operation Analytics
Market Intelligence
Each section outlines how to access specific reports, what data you can expect, and how to use it for smarter decisions.
Advertising Analytics in Amazon Seller Central refers to the suite of reports that provides detailed performance data on your paid advertising campaigns—primarily Sponsored Products and Sponsored Brands.
These reports help you understand:
How your ads are performing across different placements (top of search, product pages, etc.)
Which keywords or search terms are driving clicks and conversions
Which products are generating attributed sales after a customer interacts with your ad
What your advertising ROI looks like, including metrics like cost-per-click (CPC), click-through rate (CTR), and return on ad spend (ROAS)
By analyzing this data, sellers can optimize their campaigns, reduce ad waste, and see what’s working.
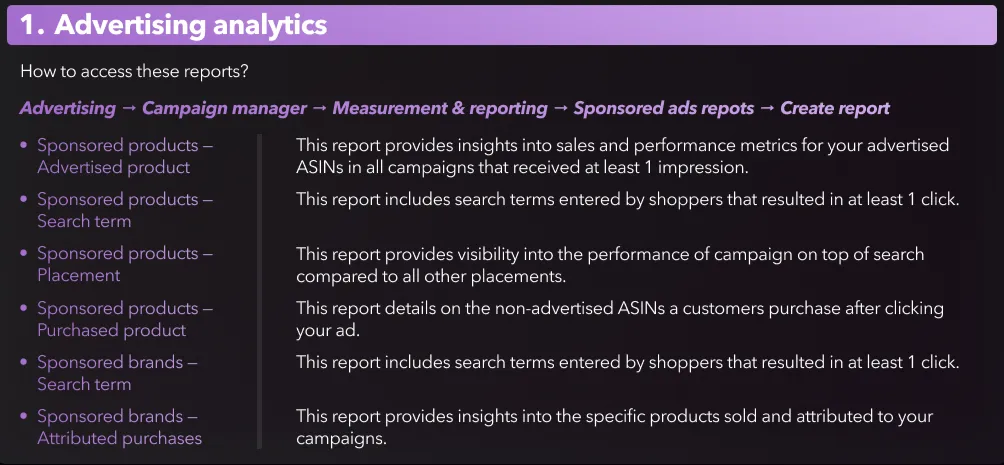
How to Access: Navigate to Advertising → Campaign manager → Measurement & reporting → Sponsored ads reports → Create report.
Once inside, you’ll have access to six major report types:
Sponsored products – Advertised product This report offers a performance breakdown of every advertised ASIN in your Sponsored Products campaigns. Metrics include impressions, clicks, cost-per-click (CPC), total ad spend, sales attributed to ads, and return on ad spend (ROAS). It’s ideal for judging how each product performs as a direct advertising investment.
Sponsored products – Search term See which customer search terms triggered your ads and led to at least one click. This data helps you identify high-converting queries and negative keywords for future campaigns.
Sponsored products – Placement Understand how ad placement affects campaign performance. For example, top-of-search (first page) placements typically convert better but cost more. Use this report to refine your bid strategy.
Sponsored products – Purchased product Learn what customers buy after clicking your ad. Often, it’s not the advertised product. This helps determine cross-selling patterns or identify listings that aren’t converting.
Sponsored brands – Search term Similar to Sponsored Products, this report shows the actual terms shoppers typed into the search bar before engaging with your Sponsored Brands ad.
Sponsored brands – Attributed purchases Track the ASINs sold and attributed to your Sponsored Brands campaigns. It helps measure how brand visibility influences sales across your catalog.
These reports form the foundation of any advertising optimization strategy. They allow for more precise keyword targeting, smarter budget allocation, and accurate performance benchmarking at both the campaign and product level.
Financial Analytics refers to the reports in Amazon Seller Central that track all financial transactions connected to your seller account. This includes:
Sales revenue
Refunds and returns
Adjustments (e.g., pricing errors, order corrections)
Reimbursements (for lost or damaged inventory)
Disposals (items removed or liquidated)
The primary purpose of Financial Analytics is to give sellers a clear view of cash flow—how much money is entering or leaving their account over time. It allows sellers to monitor revenue consistency, spot irregularities, and understand the timing and reason behind Amazon’s financial entries.
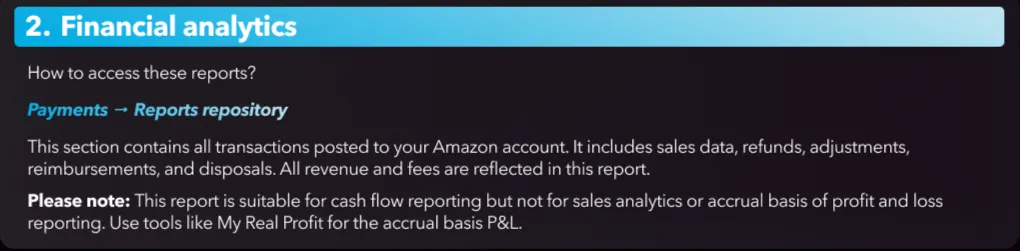
How to Access: Go to Payments → Reports repository.
This is the central location for tracking your financial transactions in Seller Central. It includes:
Sales revenue
Refunds
Adjustments
Reimbursements
Disposal transactions
These reports are updated regularly and provide a chronological, detailed log of all income and outflows connected to your account. For cash flow monitoring, this is your go-to source.
Important Consideration: This section is not suitable for profit and loss analysis under the accrual accounting method. That means it doesn’t account for inventory costs that were incurred before or after a sale, or accrued expenses not yet charged. For that, a third-party analytics tool with true P&L logic is required.
However, for cash-based tracking—knowing how much money is entering your account and when—this report is reliable and immediate.
Sales Analytics in Amazon Seller Central refers to the reports that track how your products are performing in terms of orders, units sold, and revenue. Found in the Business Reports section, these tools help sellers monitor trends over time and compare performance across different ASINs.
These reports show how many units were sold, how much revenue was generated, and how well listings are converting based on customer traffic. You can break the data down by day, week, or month to identify patterns, seasonality, or problems like low conversion rates.
In short, Sales Analytics gives you a clear view of what’s selling, how much, and how efficiently—making it essential for making informed business decisions.
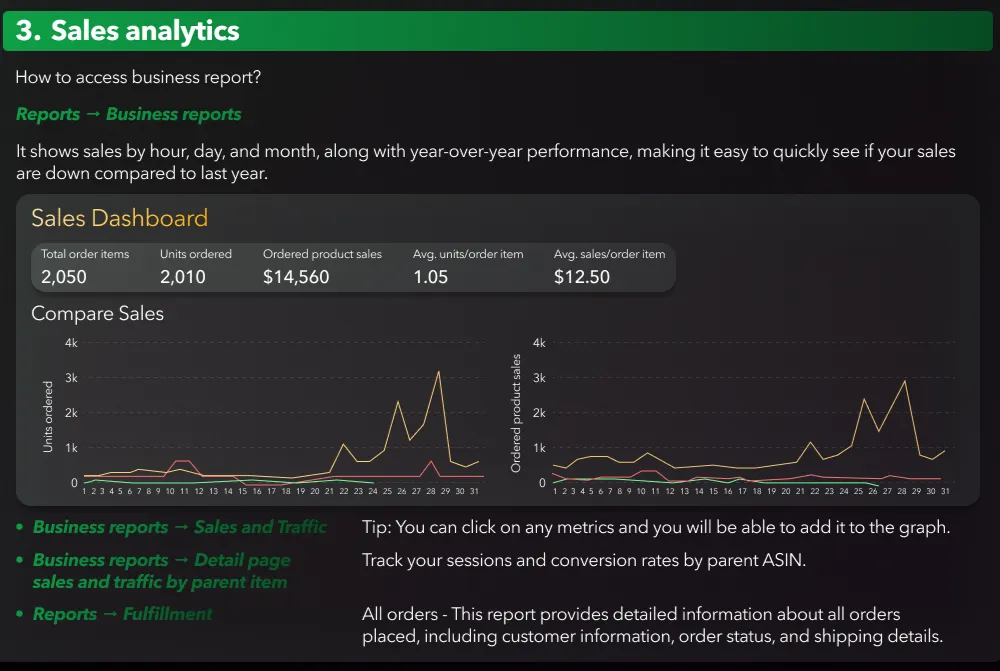
How to Access: Go to Reports → Business reports.
You’ll find dashboards that break down key performance metrics by hour, day, or month. This section helps answer critical questions like:
Are we trending up or down compared to last year?
What’s our average units per order?
What is our average revenue per order?
A typical snapshot includes:
Total order items (e.g., 2,050)
Units ordered (e.g., 2,010)
Ordered product sales (e.g., $14,560)
Average units per order item (e.g., 1.05)
Average sales per order item (e.g., $12.50)
Graphs allow for direct comparison between units ordered and product sales over time. You can click on any metric to visualize trends and layer different metrics on the same chart.
More Reports: Sales and Traffic This allows you to analyze customer behavior at the listing level—how many page views, sessions, and conversion rates a parent ASIN gets.
Detail Page Sales and Traffic by Parent Item Narrow your analysis to a parent-level overview. This is especially useful for brands with variations like color, size, or bundle configurations.
All Orders Report (via Reports → Fulfillment) This lesser-used but highly valuable report provides detailed line-by-line data about all placed orders. Includes:
Order date
Shipping method
Buyer information
Order status (fulfilled, pending, canceled)
SKU-specific quantity and price
It’s ideal for creating reconciliations between shipments and payouts or for identifying fulfillment bottlenecks.
Operation Analytics in Amazon Seller Central refers to the set of reports that help you manage inventory, fulfillment performance, and storage costs. These reports are found under the Fulfillment section and are critical for keeping your supply chain efficient and cost-effective.
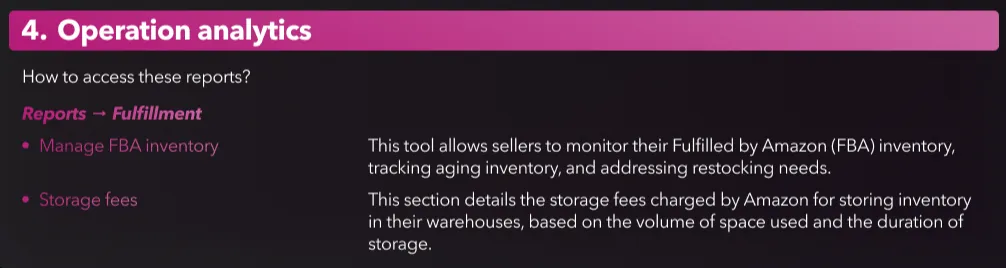
They show you how much stock you have, how quickly it’s selling, what Amazon is charging you for storage, and whether your inventory is at risk of aging or running out. This includes reports like Manage FBA Inventory, which highlights current stock levels and restock alerts, and Storage Fees, which breaks down monthly and long-term storage costs.
Operation Analytics helps sellers avoid common pitfalls like overstocking, which increases fees, and stockouts, which hurt sales and Buy Box eligibility. It’s your go-to resource for staying in control of operational efficiency on Amazon.
How to Access: Go to Reports → Fulfillment.
Here you’ll find two especially critical reports:
This allows you to:
Monitor current stock levels
Identify aging inventory
View restock alerts
Assess inventory performance index (IPI) drivers
The report flags products with overstock risk, fast-sellers that need immediate attention, and ASINs that could benefit from tighter restocking cycles.
This section breaks down Amazon’s storage charges by volume and duration. It includes:
Monthly storage fees
Long-term storage fees (LTSF)
Standard vs. oversized item fees
Cost per cubic foot
Understanding these charges helps sellers prevent excess inventory from draining profitability.
Operational Tip: Excess inventory not only increases costs but negatively affects your IPI score, which can lead to storage limits. Conversely, running out of stock hurts your Buy Box eligibility. Monitoring both sides is key.

Market Intelligence in Amazon Seller Central refers to the reports that help you understand how customers find and interact with your products through Amazon’s search engine. These insights are available under the Brand Analytics section—specifically through the Search Query Performance report.
This data shows you which search terms customers are using, how often your products appear in results, how many clicks they get, and how often those clicks lead to sales. You can analyze this information by product, keyword, or time period to track visibility, discover new keyword opportunities, and measure your share of voice.
In short, Market Intelligence helps you see what’s happening at the top of the funnel—before the sale—so you can adjust your SEO, ad strategy, and product positioning based on real customer behavior.
How to Access: Navigate to Brands → Brand analytics → Search Query Performance.
This is one of the most strategic yet underutilized report types. It provides real-time behavioral insights into how customers discover and engage with your products via Amazon search.
Key metrics include:
Number of search impressions for a keyword
Clicks generated by your listings
Conversions associated with those clicks
Rank of your brand/product for that query
You can segment this data by brand, ASIN, keyword, or time period. That makes it perfect for both tactical campaign optimization and long-term SEO planning.
How to Use It:
Identify new keywords to include in listings or campaigns
Track how your visibility evolves over time
Understand where you’re losing clicks to competitors
Measure the ROI of keyword-focused A/B testing
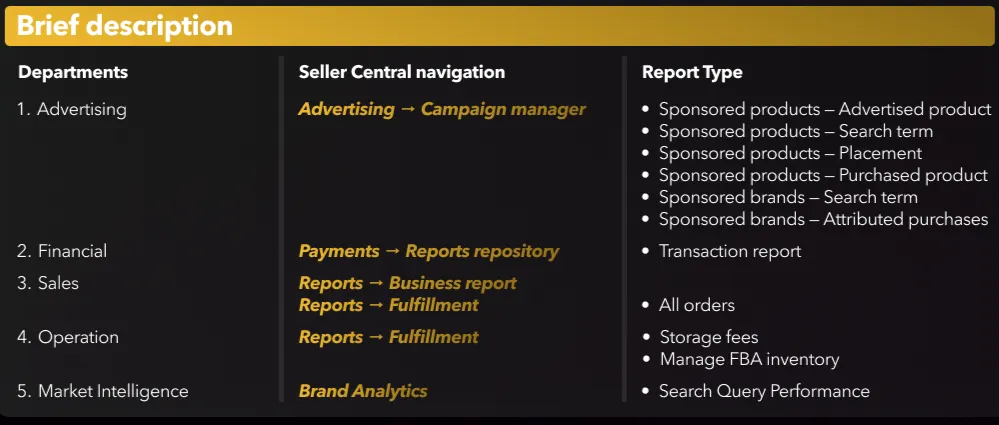
Summary of Navigation Paths and Reports To make navigation easy without the need for visuals, here is a breakdown in plain text:
Advertising Analytics → Campaign manager → Measurement & reporting → Sponsored ads reports → Create report → [Select: Advertised product, Search term, Placement, Purchased product, etc.]
Financial Analytics → Payments → Reports repository
Sales Analytics → Reports → Business reports → Sales & Traffic or Detail Page Reports
Operational Analytics → Reports → Fulfillment → Manage FBA inventory or Storage fees
Market Intelligence → Brands → Brand analytics → Search Query Performance
Amazon doesn’t make it easy to gather, connect, and interpret your data. But once you understand what’s available and where it lives in Seller Central, the platform becomes far more manageable—and valuable.
Each of these reports serves a specific purpose:
Want to reduce wasted ad spend? Go to advertising analytics.
Trying to improve margins? Start with fulfillment and storage fees.
Need better forecasting? Dive into business reports and aging inventory.
Curious about customer behavior? Tap into brand analytics and search term data.
Ready to make your data work for you?
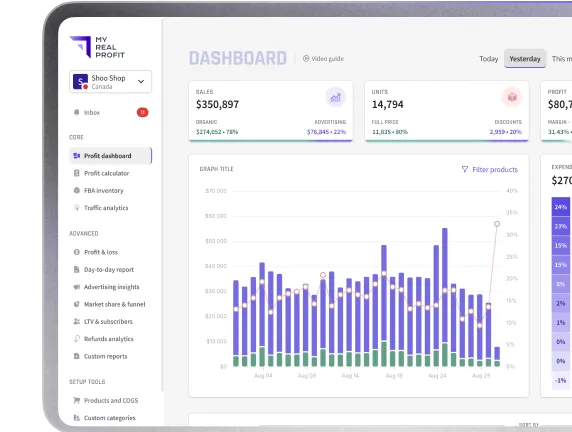
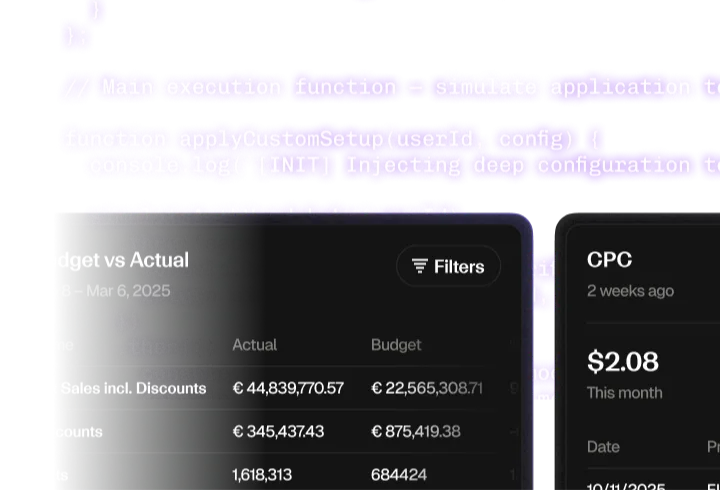
My Real Profit brings all your Amazon reports into one clear, actionable dashboard—no spreadsheets, no guesswork.
Try My Real Profit for free and start making the most out of your Amazon data today!