If you are an Amazon seller running an Amazon store or a business on any other e-commerce platform, it is essential to track your key performance indicators (KPIs) to ensure that you are profitable and on track for success.
This blog post will list 20 of the most critical KPIs you need to track to measure your business performance and its financial health. We will also provide a detailed explanation of each KPI so that you can understand how it impacts your business. Let us get started!
Sales KPIs
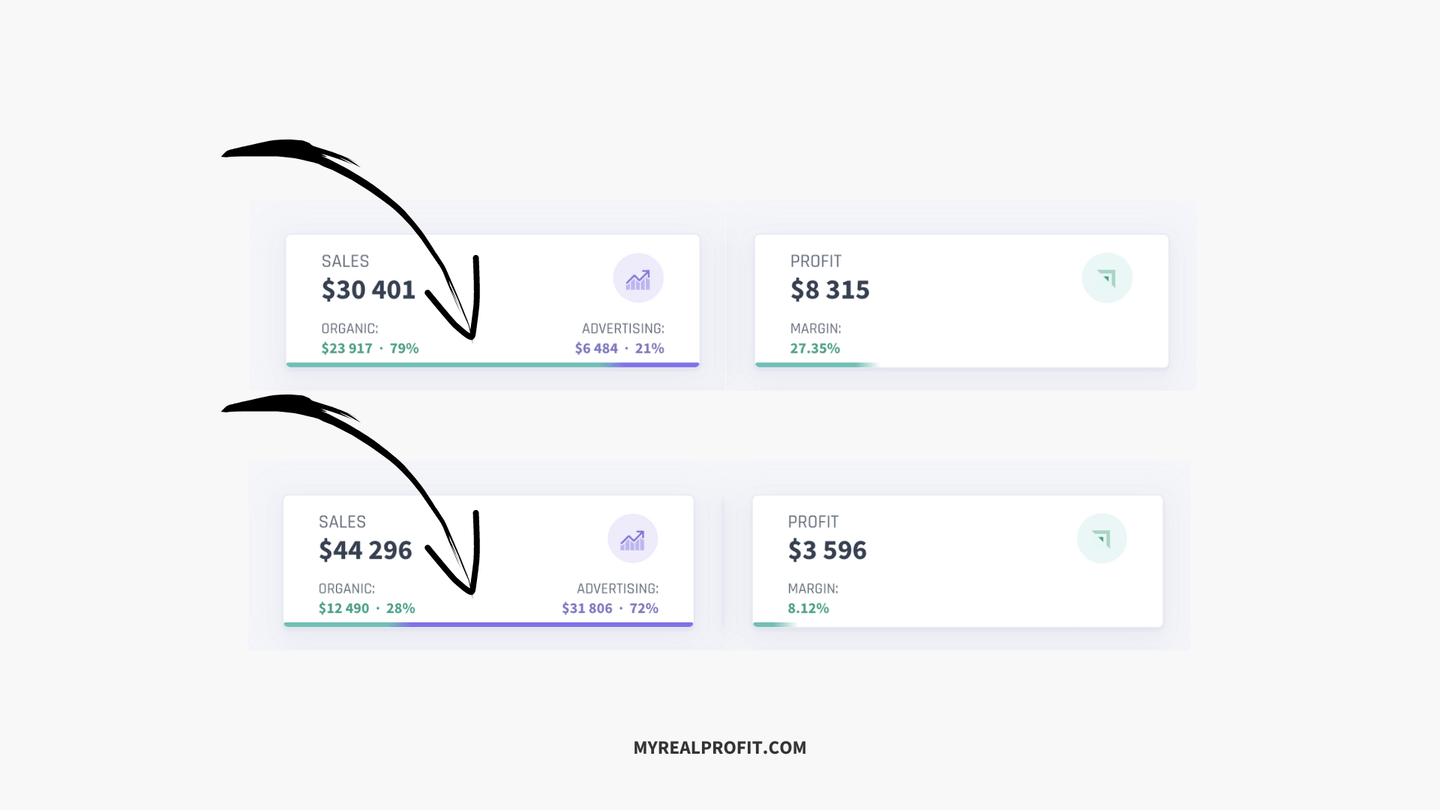
Organic Sales %
This KPI tracks the percentage of your total sales that come from organic traffic (i.e. non-paid traffic). To calculate this KPI, simply take your total sales and subtract ad sales and divide it by your total sales.
Organic Sales % can help you track your SEO effectiveness and how strong your keyword positions are.
Organic Sales % = (Total Sales – PPC Sales) / Total Sales * 100%

Average Purchase Price (APP)
This KPI tracks the average amount people spend purchasing your product. To calculate this KPI on Amazon, divide the total sales by the number of orders.
Average Purchase Price can help you to track the average order value and ensure that your product is priced correctly.
APP = (Total Sales – Discounts) / Tota Units Sold
Sales Velocity
This metric tells you the average number of sales per day over a given period. To calculate this, take the total number of sales over a particular time and divide it by the number of days in that period.
Sales Velocity can help you to track the dynamics of your daily business sales and ensure that it is not lowering. Also, sales velocity is very helpful when you do inventory planning.
Sales Velocity = Total Units Sold / Days
Advertising KPIs
ACoS, RoAS, and TACoS
ACoS = PPC Spend / PPC Sales * 100%
ACoS (advertising cost of sale)
To calculate ACoS, divide your total ad spend by your total ad sales.
ROAS = PPC Sales / PPC Spend * 100%
RoAS (return on ad spend)
To calculate RoAS, divide your total ad sales by your total ad spend.
TACoS = PPC Spend / Total Sales * 100%
TACoS (total advertising cost of sale)
To calculate TACoS, divide your total ad spend by your total sales.
PS. TACoS, Total ACoS, Total Advertising Cost of Sales, ACoTS – the same metric 🙂


All these 3 Amazon KPIs can help you understand how much you’re spending on ads and whether or not that spend is resulting in a profit.
Break-Even (BE ACoS, RoAS, TACoS, CPA)
Break-Even ACoS/RoAS/TACoS is the line between profit and loss in advertising: you will either start making or losing profit from advertising.
BE ACoS & TACoS = Product Profit Margin %
BE CPA = Profit Per Unit in $
BE ROAS = Sale Price / Profit Per Unit in $
Read also: How to calculate your product profitability
Click Through Rate (CTR)
This Amazon KPI tracks the percentage of people who see your ad and click on it. To calculate this KPI, divide the number of clicks on your ad by the number of impressions.
This KPI can help you track your ads’ effectiveness in getting people to click on your ad and understand if you picked the right audience for your product.
Click Through Rate (CTR) = Clicks / Impressions * 100%
Cost Per Click (CPC)
This Amazon KPI tracks the average amount you’re paying per click on your ad. To calculate this KPI, divide your total ad spend by the number of clicks on your ad.
This KPI can help you understand how competitive the keyword is (higher CPC -> more competition for showing an ad), track the cost of your ads, and make necessary adjustments to ensure that you’re profitable and fit the budget.
CPC = Ad Spend / Clicks * 100%
Advertising Conversion Rate (Ad CVR)
This Amazon KPI is essential for any Amazon seller. Advertising conversion rate is the case also. It is the percentage of people who make a purchase after seeing your ad. To calculate this KPI, divide the number of conversions by the number of clicks.
A conversion rate can help you understand how “attractive your listing” is and if you picked the right audience for your product.
Advertising Conversion Rate (Ad CVR) = Total Ad Orders / Clicks
Cost Per Action (CPA)
This Amazon KPI tells you how much money you need to invest into PPC to get a conversion (sale). To calculate this Amazon KPI, divide your total ad spend by the number of sales.
This metric is important because it allows you to track the cost per purchase and use it for your future unit economics (product profitability).
Cost Per Action (CPA) = Total Ad Spend / Ad Orders
Discount Redemption Rate
If you offer discounts or coupons, this KPI tracks the percentage of people who redeem them.
To calculate this Amazon KPI, divide the number of redemptions by the total number of coupons or discounts offered. This KPI is important because it allows you to track your discount campaigns’ effectiveness in getting people to purchase your product.
Discount Redemption Rate = Number of Redemptions / Total Units Sold
Coupon usage average statistics ($20 product, home&kitchen category)
Coupon: 1 – 5% | Usage rate: < 35%
Coupon: 6 – 9% | Usage rate: 45%
Coupon: 10 – 14% | Usage rate: 55%
Coupon: 15 – 20% | Usage rate: 60%
Coupon: 21% + | Usage rate: 70%
Why do you need to track it?
If the usage rate is higher than your category average, you are underpricing your product, and you can decrease coupons by x% without seeing a big difference in sales velocity.
Also, remember that for every coupon redeemed, you pay Amazon $0.6 each.
All these amazon kpis will help you keep an eye on advertising performance. We recommend tracking these KPIs on the brand, portfolio or campaign level as well as on the ASIN level.
My Real Profit offers advanced advertising reporting that shows you all KPIs above and even more.
Operation KPIs
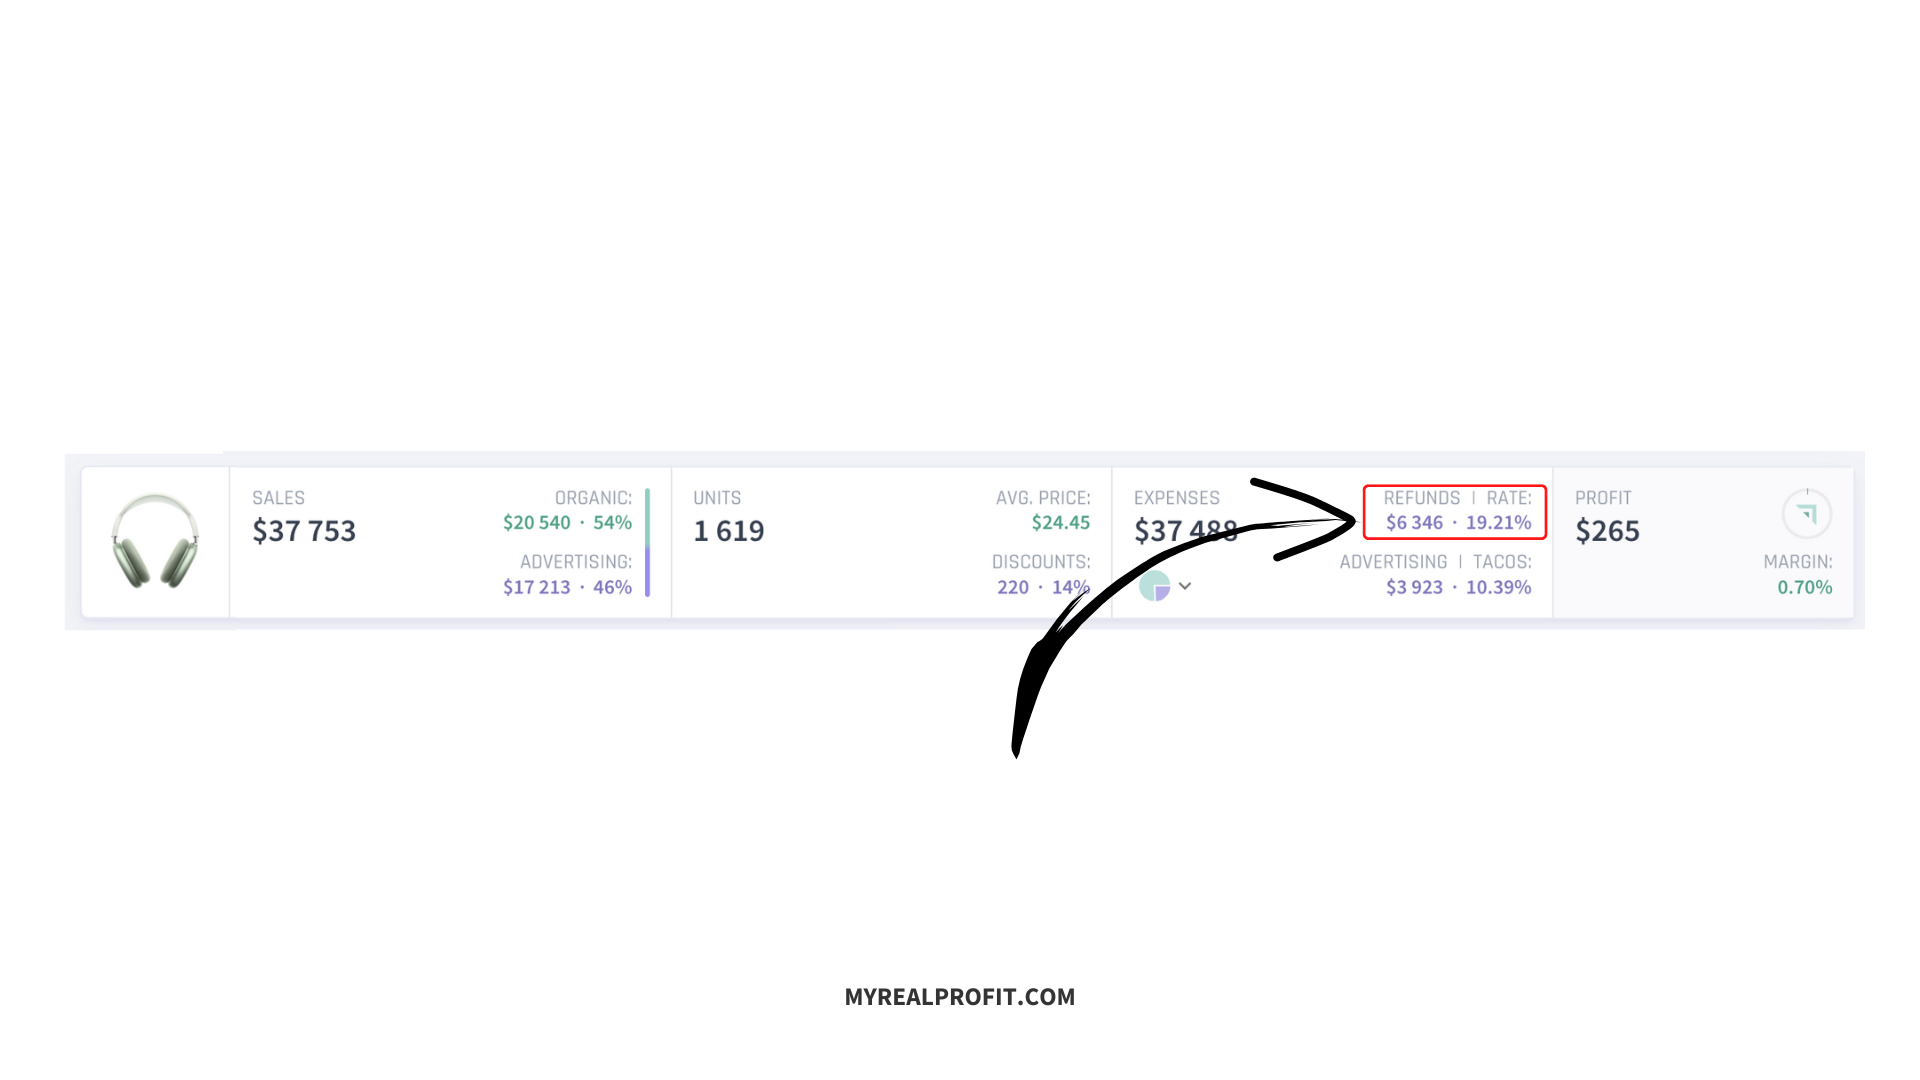
Refund Rate
This KPI tracks the percentage of orders that are refunded. To calculate this KPI, simply divide the total number of refunds by the total number of orders. This KPI is important because it ensures that you provide a quality product and track a defect rate and customer satisfaction.
Refund Rate = Total Returns / Total Units Sold

Return on Investment (ROI)
This is one of the most critical Amazon key performance indicators that track the profitability of your business. To calculate this KPI, take your profit and subtract by COGS (product cost, delivery from China, etc.).
This Amazon KPI can help you see how much money you earn on each dollar invested into inventory. We recommend tracking these Amazon KPIs on the brand level as well as on the ASIN level, especially during scaling, as it directly impacts your business growth.
ROI = (Profit / Product Cost (landed)) * 100%
Out of Stock Rate (OOS %)
This Amazon KPI tracks the percentage of time that your product is out of stock. To calculate this, take the total number of days your product was out of stock and divide it by the total number of days you were selling it.
This KPI is important because it allows you to track inventory levels and ensure that you are not losing sales due to being out of stock and helps you improve your inventory management processes.
OOS % = Days Out of Stock / Total Days
Inventory Turnover Ratio
This KPI tracks how fast you’re selling through your inventory. To calculate this KPI, divide the cost of goods sold by your average inventory.
This KPI is important because it allows you to track your inventory management efficiency and your primary business asset performance.
Inventory Turnover Ratio = Cost of Goods Sold (landed costs) / Inventory Cost
Customer Behavior
Conversion Rate (CVR)
This amazon KPI tracks the percentage of sessions to your listing who take the desired action – a purchase.
To calculate this amazon KPI, simply divide the number of orders by the total number of sessions. This KPI is important because it allows you to track the effectiveness of your listings in converting visitors into customers.
CVR = Total Orders / Sessions (Product Detail Page Visits)
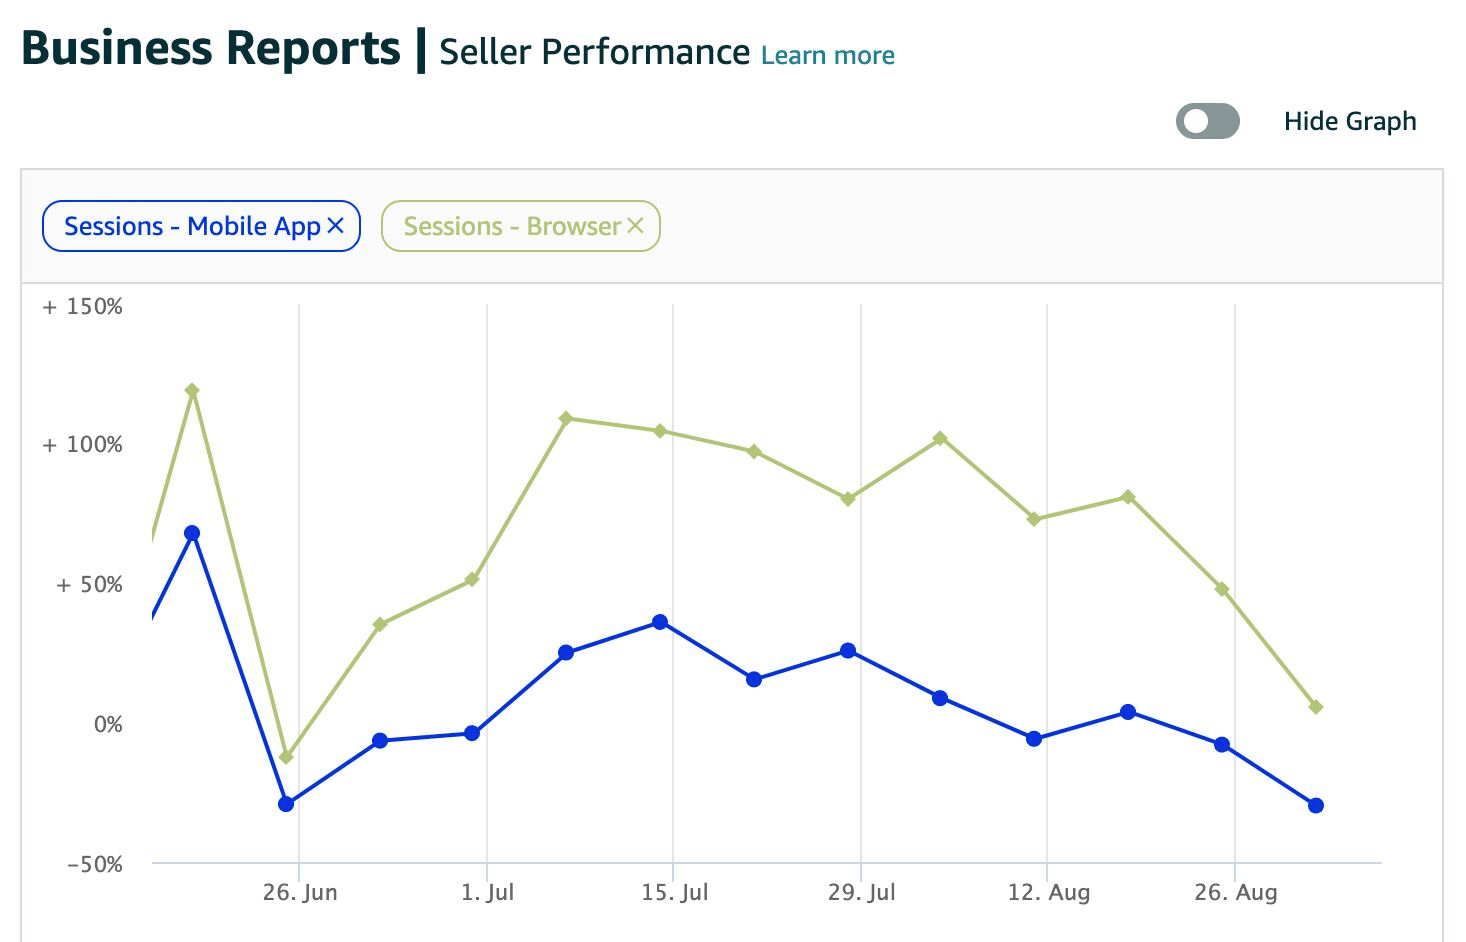
You can use Business Reports to track your sessions and conversion rates by account.
If you want to track it by item level, you can check: My Real Profit

Reviews Per Unit
This metric tells you the average number of reviews that your product has. To calculate this, simply divide the total number of reviews for your product by the total number of units sold. This metric is important because it allows you to track customer satisfaction and ensure that you provide a quality product.
Reviews Per Unit = Total Reviews Gained / Total Units Sold
Add-to-Cart Rate (ATC Rate)
This KPI tracks the percentage of sessions where a product is added to the cart. To calculate this, take the total number of items added to the cart and divide it by the total number of sessions.
This KPI is important because it allows you to track customer engagement with your product and understand what percentage of your customers are churning and how likely they are to purchase it.
You can track your Add-to-cart rate using brand analytics reports.
ATC Rate = Total Add-to-Carts / Sessions
(Bonus) Amazon business KPIs
Buy Box %
For sellers on Amazon, the Buy Box is the box on a product detail page where customers begin the purchase process by adding items to their shopping carts. A seller must be “Winning” the Buy Box to have their offers visible when customers add items to their shopping cart.
The Buy Box share metric tells you what percentage of the time your offers are visible in the Buy Box vs other sellers’ offers.
You can use Business Reports to track your buy box percentages.
Inventory Performance Index (IPI)
This metric is a number from 0 to 1000 that measures how well you sell on Amazon. If your IPI falls below 350, then Amazon will limit how much inventory you can send.
Account Health Rating (AHR)
The Amazon Account Health Rating (AHR) is a feature that monitors your compliance with Amazon’s selling policies. Adherence to these standards is based on factors such as unresolved policy violations within a given time.
Professional sellers can currently access this information in their seller central account. Although always subject to change, it is evident that Amazon wants its sellers to maintain healthy accounts according to their guidelines. A few recent refinements have been made regarding how you can monitor your account health, but more updates will come from the retail giant soon.
Wow, that’s a lot of metrics… Any automated solutions that can help me?
You can use My Real Profit to get all the analytics in just a few clicks. It will automatically take all your data safe from Amazon and create a dashboard with KPIs data and a product dashboard with detailed information on your expenses, metrics, and profit margins.
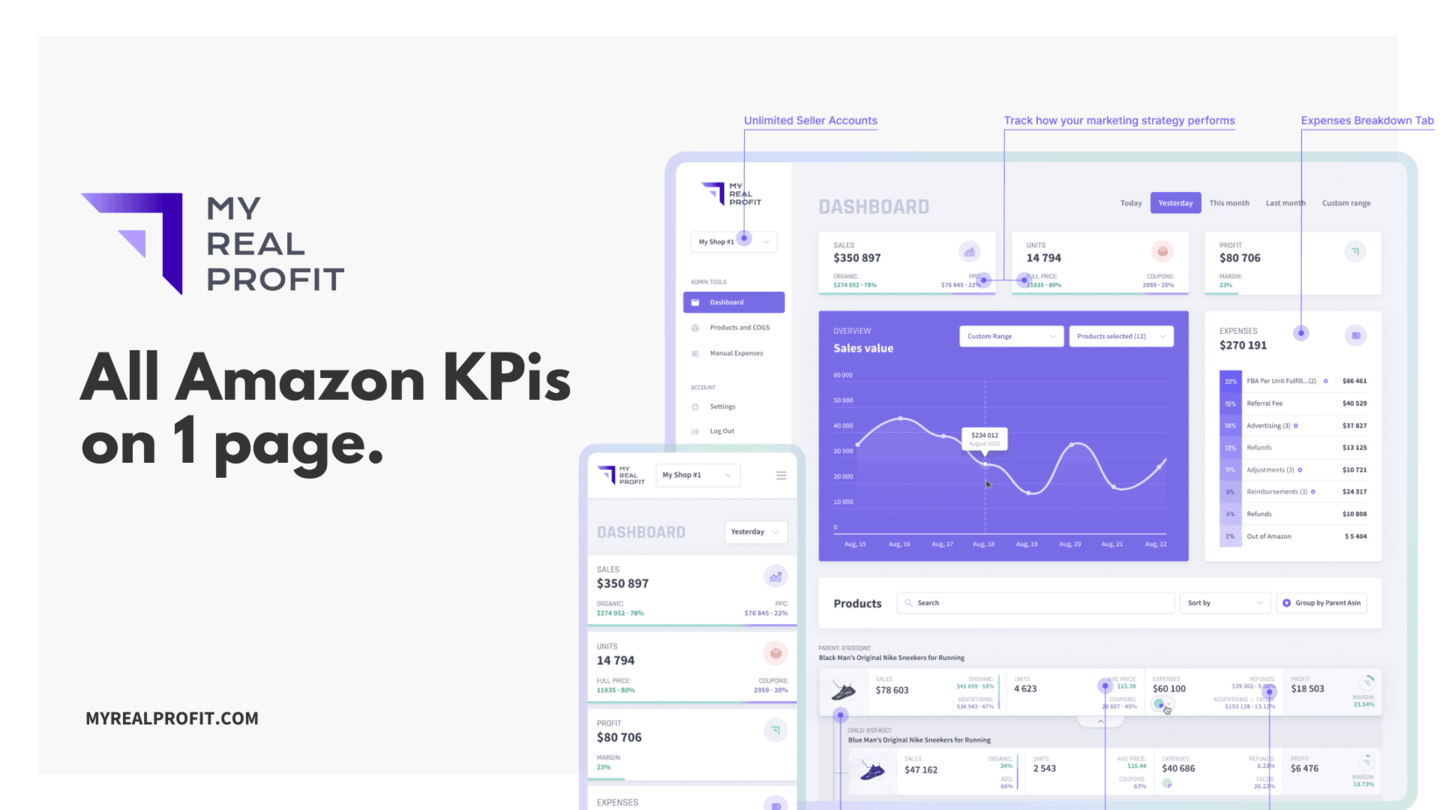

It is a must-have for tracking your amazon KPIs
Schedule a call for a demo: LINK TO SCHEDULE A DEMO
Sign up for a free trial using the link below: LINK TO START A FREE TRIAL

