We’re part of:
Trusted by
industry leaders
100%
NTB accuracy
3×
Faster Insights
2×
Subscriber Growth
40%
NTB increase
100%
Auto Reporting
50hrs+
Saved
-18%
Wasted ad spend
10x
Decision Speed
5hrs+
Saved Daily
100%
Profit Clarity
3×
Optimization
100%
Branded view
100%
Centralized Data
5×
Reporting Speed
+13%
Gross margin
−22%
Refund reduction
4×
Efficiency Gain
100%
Cost Control
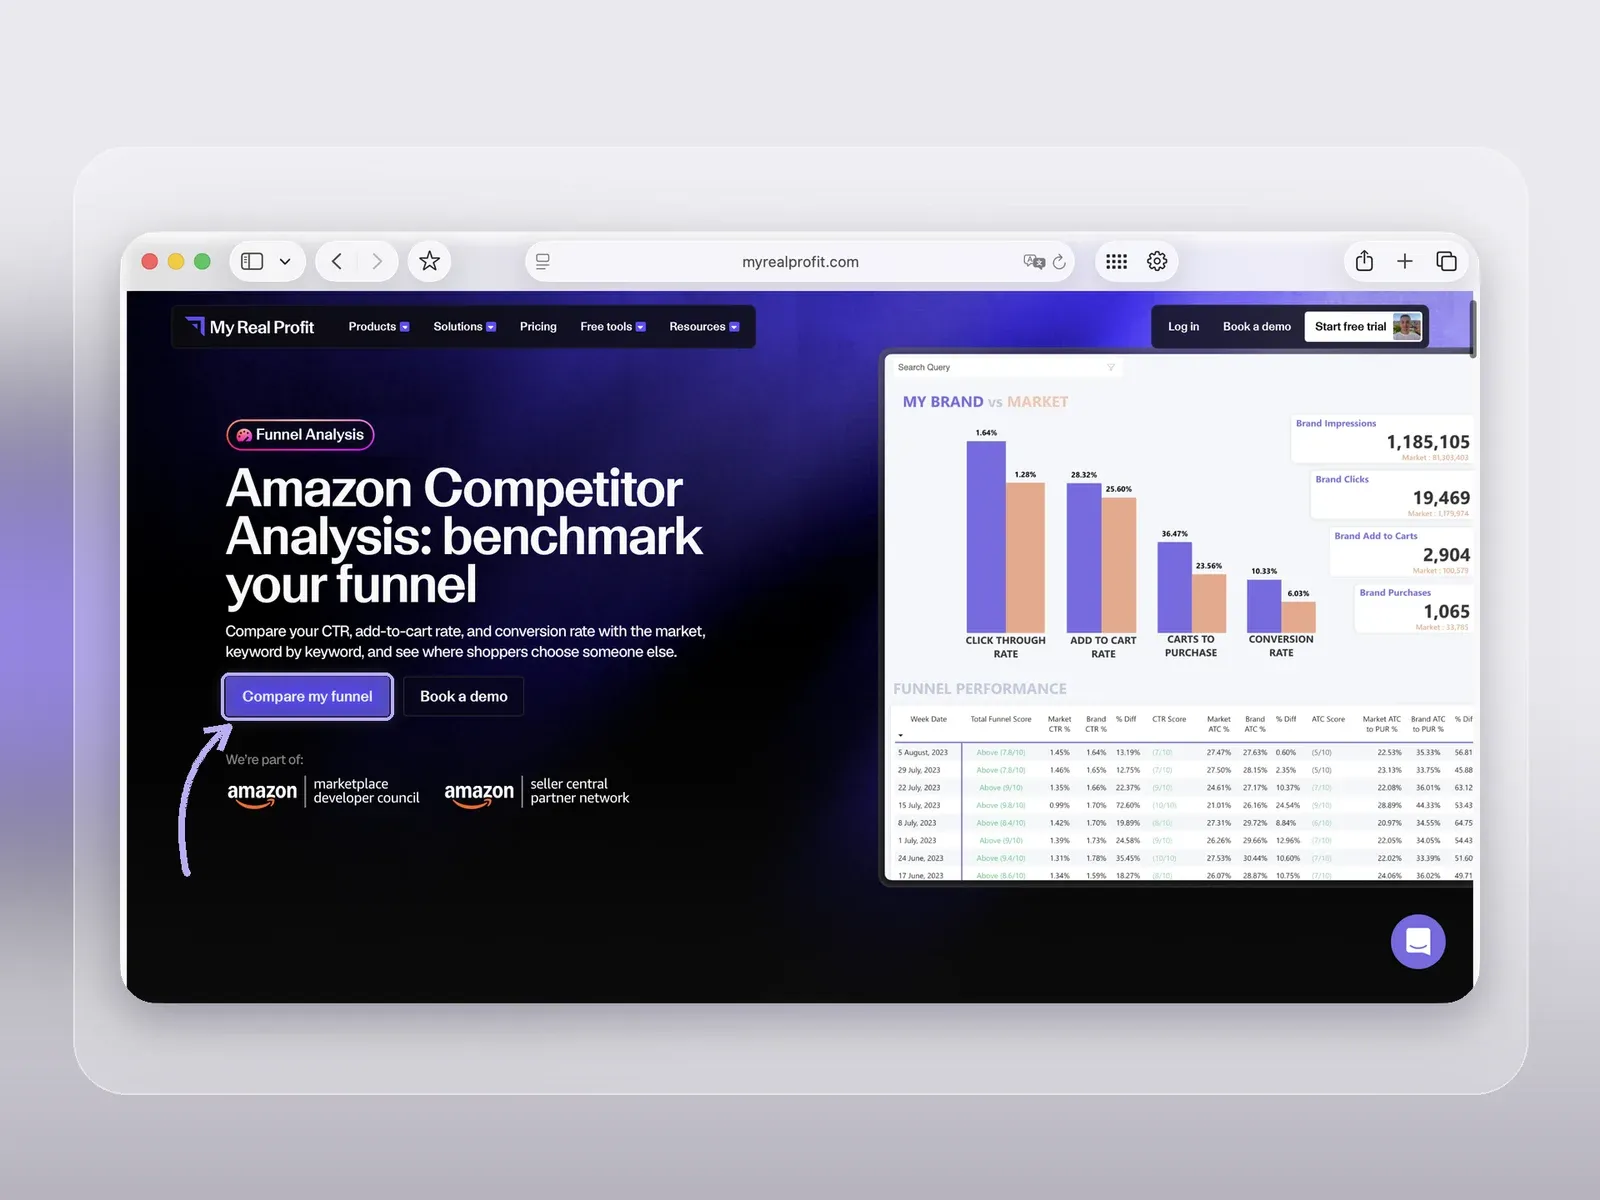
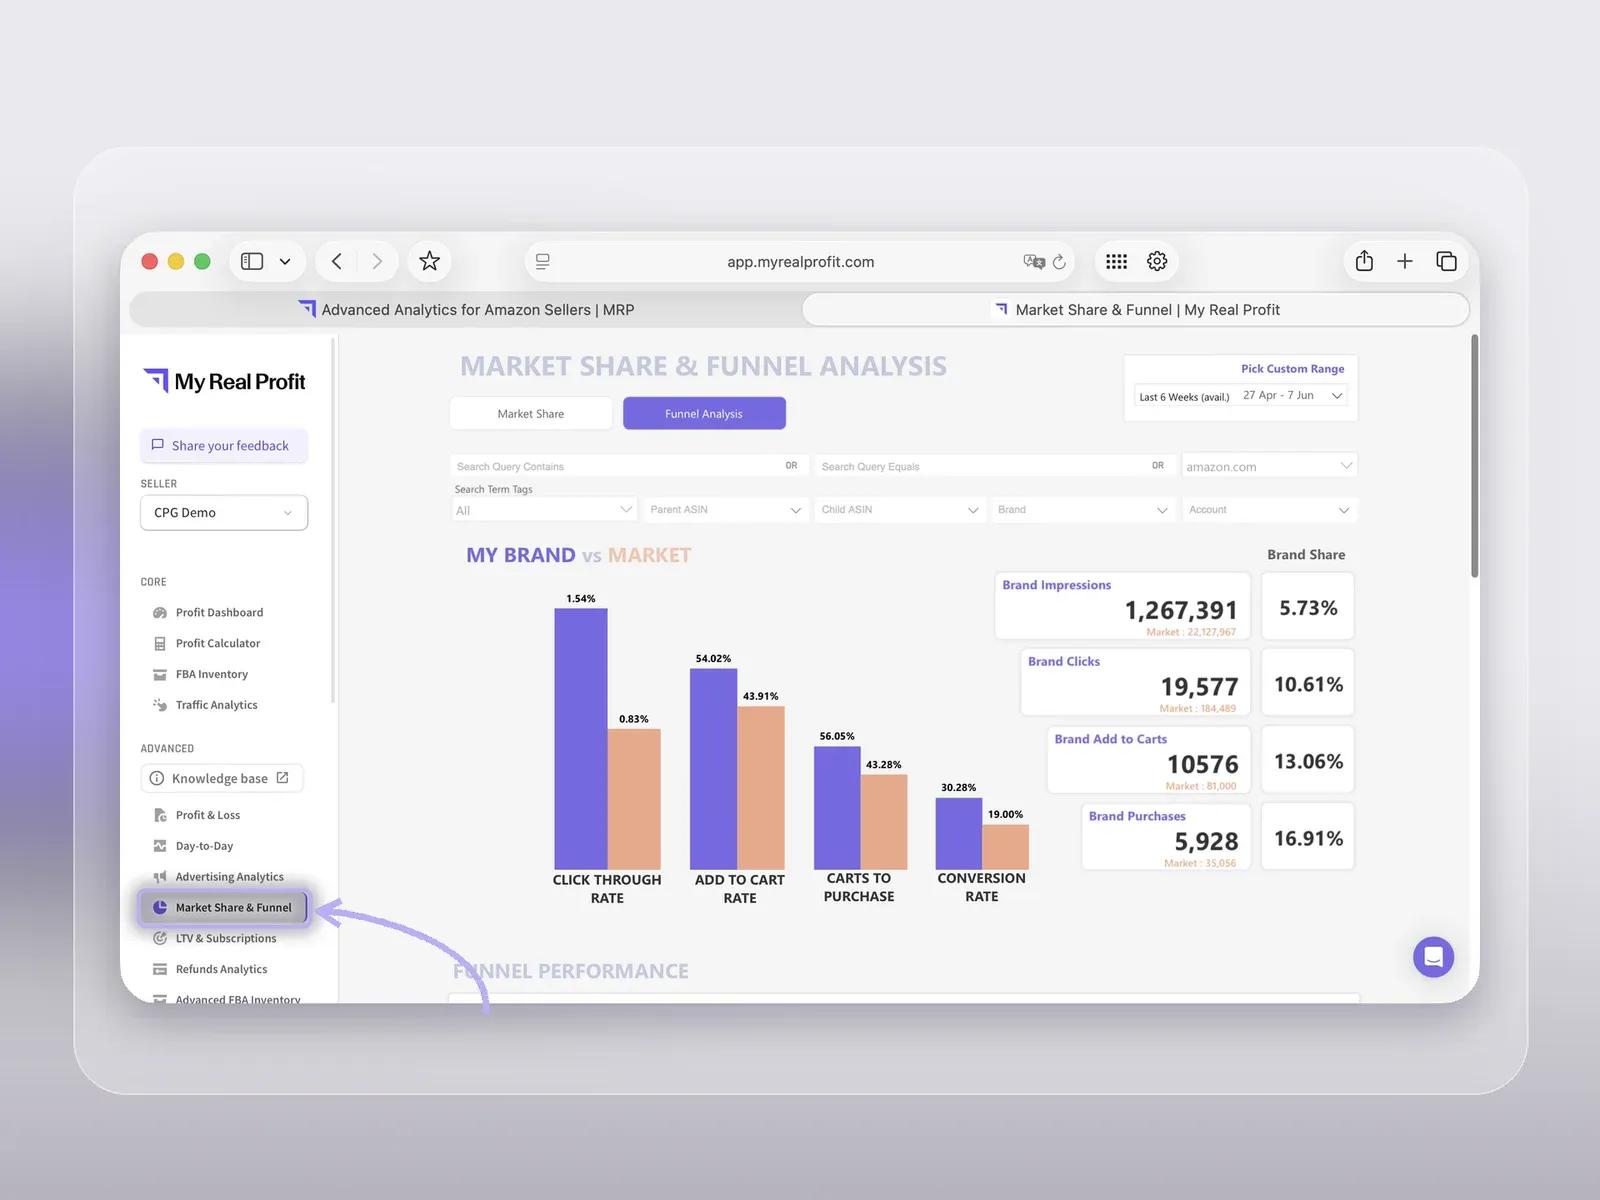
Amazon competitor analysis inside My Real Profit compares your funnel with the market for each keyword and ASIN. In the app, you find it as the Funnel Analysis page of Market Share & Funnel.
Your own CTR or conversion rate means little on its own. The same CTR can be weak on one keyword and normal on another. This kind of Amazon competitor research puts your CTR, add-to-cart (ATC) rate, and conversion rate (CVR) next to the market average for the same keyword. So you see where the gap is, and at which stage of the funnel.

Everything below serves one job: spotting the keywords where shoppers slip away to other listings, and choosing what to fix first.
Each stage points to a different problem. If your CTR is below the market, shoppers see your product and click another one: check the main image, price, title, and reviews. If CTR is fine and the ATC rate is low, the listing does not build enough intent: check the content, images, and offer. If both are fine and CVR is low, shoppers want the product and still do not buy it.
You may have hundreds of keywords to check. The Funnel Score sums up your performance across impressions, clicks, add-to-carts, and purchases on a scale from 0 to 10. A score of 5 means you perform at the market average. A keyword with strong search demand and a low score is where you have the most room to take more of that demand.
After you change a main image, a price, or a PPC strategy, compare two periods. You see how CTR, ATC rate, and CVR moved on each keyword. This does not prove that one change caused the result. It shows when and where the funnel changed, so you know where to look. Check your price against the market price too, before you credit a content change.
Competitor Analysis sits next to the other My Real Profit reports, and a human data team stands behind all of them. The platform also covers:
Follow each dollar from sales down to net profit in the Amazon profit and loss statement, with COGS, Amazon fees, refunds, and marketing as separate lines.
Scan your core Amazon KPIs in a single heat-map table.
Break down campaign results hour by hour in advertising analytics.
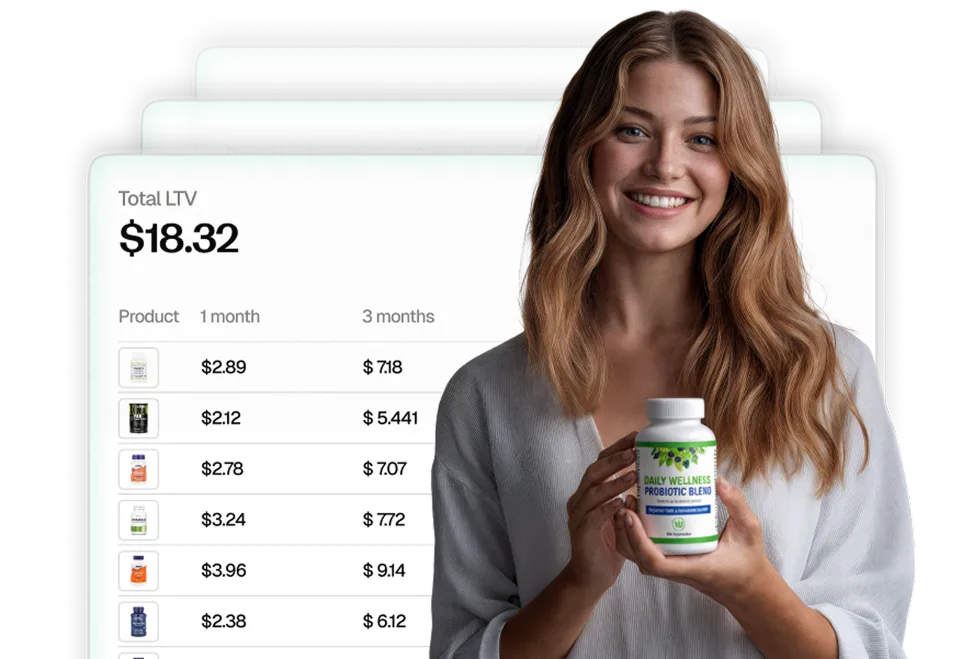
Measure what a customer is worth over the months with customer lifetime value, cohorts, and Subscribe & Save retention.
Watch your search query market share at every step: impressions, clicks, cart adds, and purchases.
Learn what drives returns and how your refund rate moves by day, week, and month.
Data comes in through Amazon's official SP-API and Advertising API and refreshes on its own. It only reads data, so it never changes your listings or prices.
Three steps take you from sign-up to your first funnel comparison.
Press 'Compare my funnel' above, complete the form, then click 'Start 21-day free trial'.
You don't need a credit card.
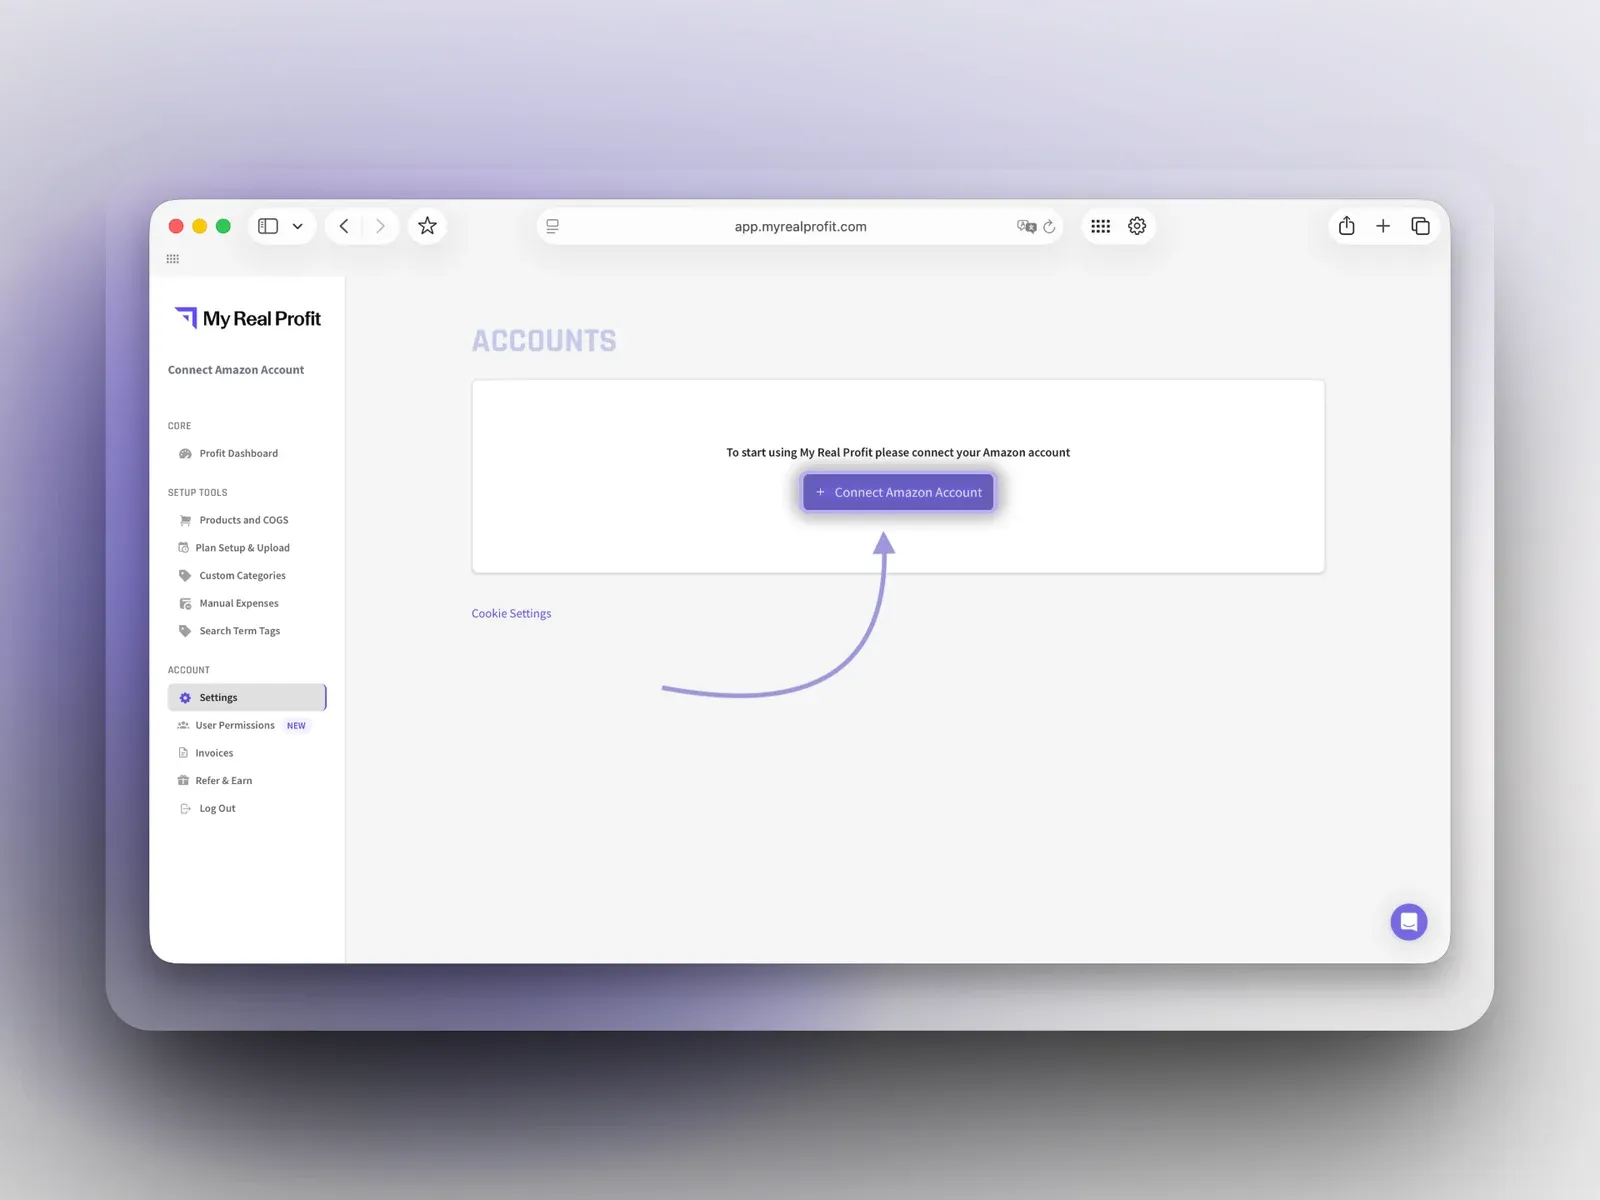
Choose 'Connect Amazon Account' and select your region: North America, Europe, or Far East. Add your Advertising account as well, so PPC data comes in too. The whole connection takes less than five minutes.
Data starts importing right away, and full reports are ready in 2 to 3 days. Open Market Share & Funnel under Advanced in the left menu, then the Funnel Analysis tab. Select a keyword or an ASIN to see your CTR, ATC rate, and CVR beside the market's.
You need the Advanced plan for this report.
See which high-demand keywords you underperform on, and at which funnel stage, before you plan the next quarter.
Find keywords where the ad spend is fine and the listing loses shoppers after the click.
Check how CTR and CVR moved after a new main image, title, or A+ content.
Show each client where their funnel trails the market, with one benchmark for every account.
An Amazon competitors analysis that stops at who ranks above you shows who wins the shopper. It does not show why.
Competitor Analysis inside My Real Profit compares your funnel with the market on every keyword. You see where you lose shoppers, which keywords give you the clearest chance to grow, and whether your fixes worked. You can test it on your own keywords during the 21-day free trial.
Book a free demo call or start your free trial today and see
exactly how it works for your business.