


June 28, 2023 ● 9 min read
Amazon Seller Reports Guide: All Reports Explained With Links


As an Amazon seller, you have access to a large volume of data. However, not all Amazon metrics are equally useful when it comes to making decisions that impact profit.
The truth is that many sellers track revenue, units sold, and ACoS. While these are important, they only provide a partial view of performance. Without understanding how different Amazon KPIs interact, it becomes difficult to identify where profit is being created and where it is being lost. This is why structured tracking is critical.
In this guide, we’ll break down the most important Amazon metrics, explain how they connect to PPC performance, and highlight three underestimated KPIs that directly impact profitability.
At first glance, revenue growth may seem like the ultimate indicator of success. However, revenue alone does not reflect efficiency.
For example:
This is where Amazon KPIs become essential. Instead of focusing on isolated numbers, experienced sellers analyze how metrics work together. This allows them to make decisions based on profitability, not just growth.
To better understand your business, it helps to group Amazon metrics into categories. This creates structure and makes analysis more actionable.
These metrics measure revenue, margins, and overall profitability.
Examples include:
These Amazon metrics answer one key question: Are you actually making money? (and how to calculate that profit accurately across all costs.)
However, looking at only one metric rarely gives the full picture. For example, sales may grow while margins shrink, or advertising may increase revenue while reducing overall profitability.
This is why it’s important to understand how each metric contributes to the broader financial performance of your business. So, let’s break down the most important Sales & Profit metrics one by one.
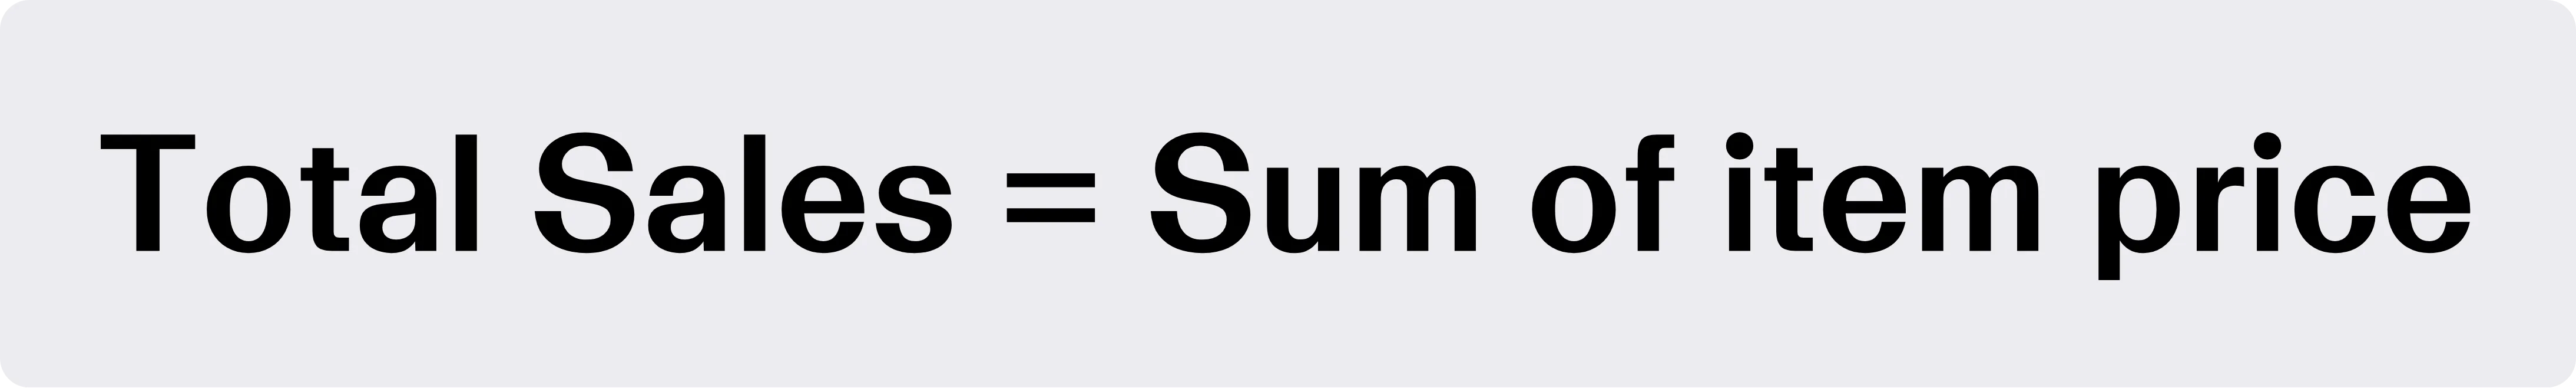
1. Total Sales
Total Sales represents the overall revenue generated from customer purchases during a selected time period, including shipped and pending orders.
Calculation:
2. AOV (Average Order Value)
AOV measures the average dollar amount customers spend per order and helps sellers understand purchasing behavior and pricing efficiency.
Calculation:

3. Units Sold
Units Sold measures the total number of product units sold during a selected time frame.
Calculation:

4. Orders
Orders represent the total number of unique customer orders placed during a selected period. Since one order may contain multiple units, Orders and Units Sold should be analyzed together.
Calculation:

5. Cost of Goods Sold (COGS)
COGS represents the total inventory cost associated with the products sold during a selected period and directly impacts profitability and break-even calculations.
Calculation:

6. Customer Lifetime Value (CLTV)
CLTV measures the total revenue generated per unique customer over time and is especially important for brands focused on repeat purchases and subscriptions.
Calculation:

7. Fulfillment Fees
Fulfillment Fees represent the cost of shipping and delivering products through Amazon FBA or FBM operations.
8. Referral Fees
Referral Fees are commissions paid to Amazon for each sale and vary depending on the product category.
Calculation:

9. Advertising / PPC Cost
Advertising Cost measures the amount spent on Amazon PPC campaigns, including Sponsored Products, Sponsored Brands, and Sponsored Display ads.
10. Advertising Sales / PPC Sales
PPC Sales represent the total revenue generated directly from Amazon advertising campaigns.
11. Refunds
Refunds measure the total cost associated with returned orders, including refunded revenue, processing fees, and related adjustments.
12. Storage Fees
Storage Fees represent the cost of storing inventory inside Amazon fulfillment centers and can significantly impact margins for slow-moving products.
13. Discounts
Discounts measure the total amount spent on promotions such as coupons, Subscribe & Save offers, and brand-tailored discounts.
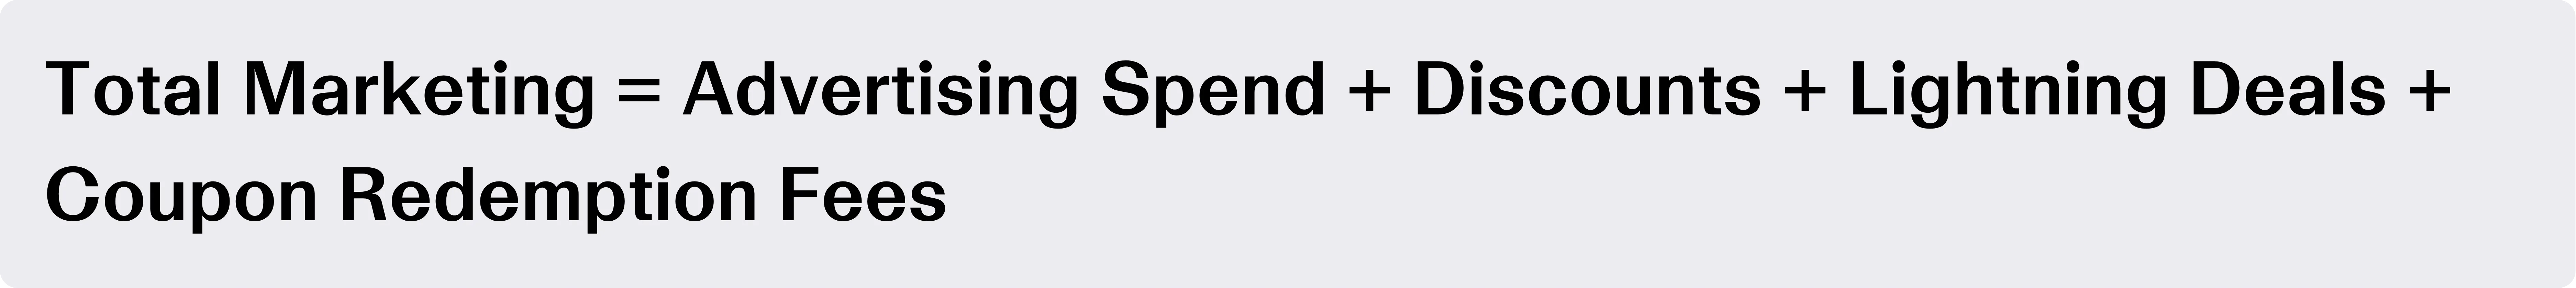
14. Total Marketing
Total Marketing combines all marketing-related expenses, including PPC spend, discounts, coupon fees, and lightning deals.
Calculation:
15. Total Marketing %
Total Marketing % shows how much of your revenue is spent on marketing activities.
Calculation:

16. Average Price
Average Price measures the average selling price per unit after discounts are applied.
Calculation:

17. Refund Rate (Units)
Refund Rate measures the percentage of sold units that were refunded by customers.
Calculation:

18. Refund Rate ($)
Refund Rate in dollars measures the percentage of revenue lost to refunds.
Calculation:

19. ROI (Return on Investment)
ROI measures how much profit is generated relative to inventory costs and helps sellers evaluate investment efficiency.
Calculation:

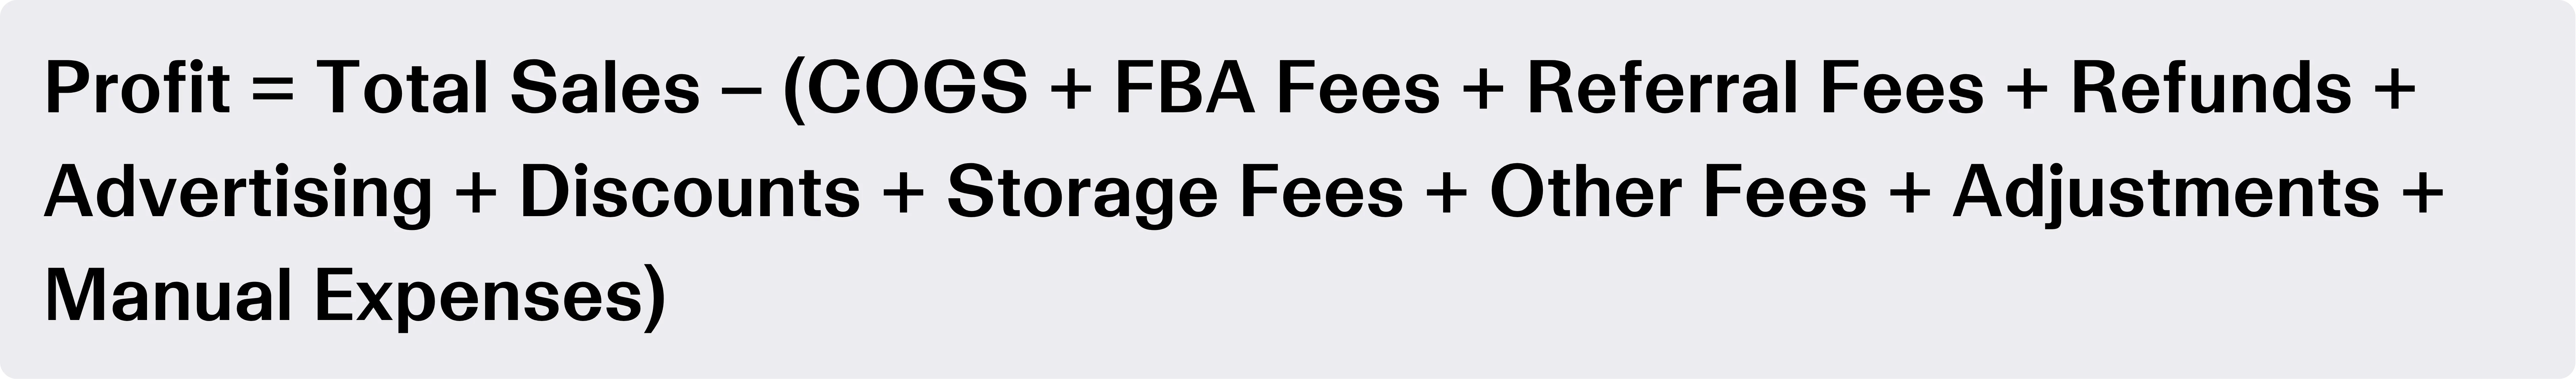
20. Profit
Profit measures the net income remaining after subtracting all major business expenses from revenue.
Calculation:
Profit Margin Calculation:

Profit Per Unit Calculation:

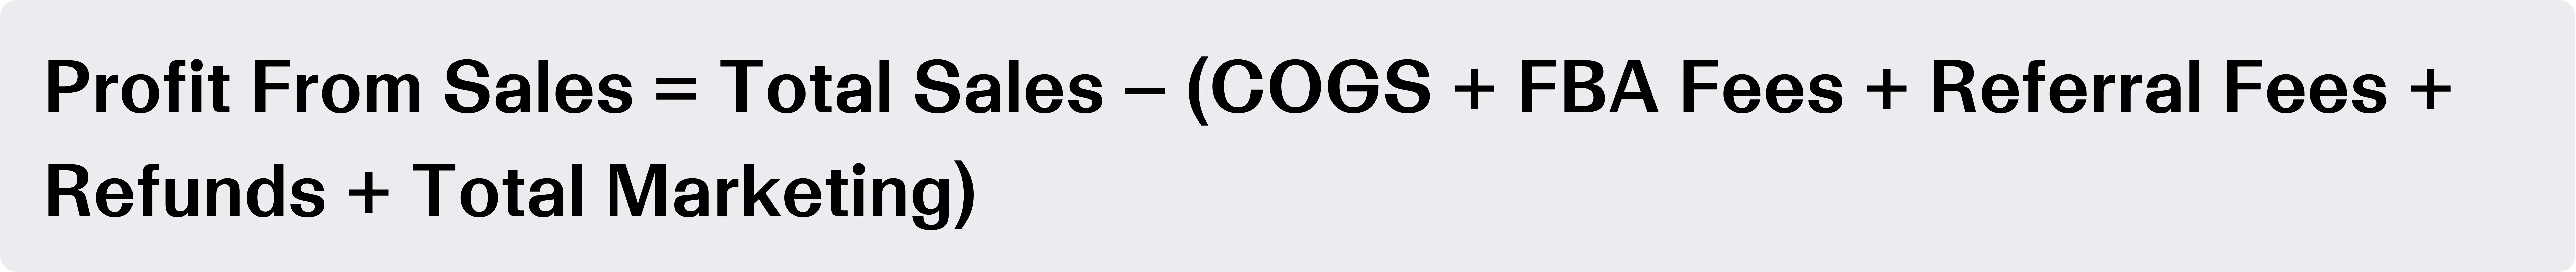
21. Profit From Sales
Profit From Sales measures operational profitability by excluding account-level adjustments and unrelated expenses, making it useful for evaluating marketing and sales efficiency.
Calculation:
Profit From Sales Margin Calculation:

Profit From Sales PPU Calculation:

Now that we’ve covered Sales & Profit metrics, let’s move into advertising metrics, which are essential for evaluating PPC performance and understanding how efficiently your ad spend contributes to traffic, conversions, and overall sales growth.
Examples include:
These metrics help you understand:
To better understand PPC performance, let’s break down the most important advertising metrics one by one.
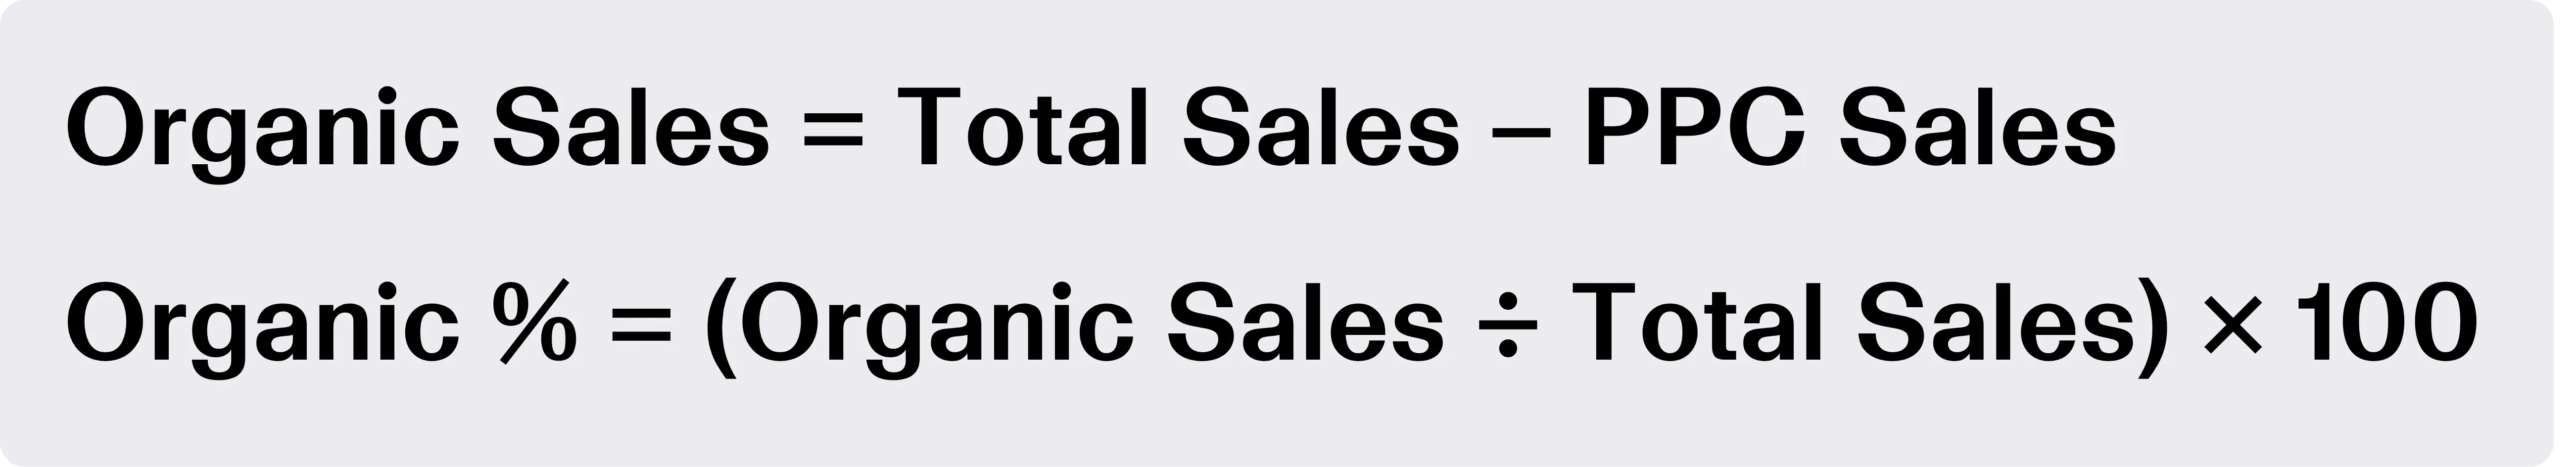
1. Organic Sales and Organic %
Organic Sales measures the portion of revenue generated without advertising, helping sellers understand how much of their growth comes from organic visibility rather than PPC performance.
Calculation:
Organic Sales = Total Sales – PPC Sales
2. ACoS / PPC ACoS
ACoS (Advertising Cost of Sales) measures how much advertising spend is required to generate ad revenue. It is one of the most important Amazon KPIs for evaluating PPC efficiency.
Calculation:
PPC ACoS = (PPC Spend ÷ PPC Sales) × 100

3. TACoS / PPC TACoS
TACoS (Total Advertising Cost of Sales) measures advertising spend relative to total revenue and helps sellers understand the long-term impact of PPC on overall business growth.
Calculation:

4. PPC CPA (Cost Per Action)
PPC CPA measures the average advertising cost required to generate one order through Amazon PPC campaigns.
Calculation:

5. PPC Conversion Rate (PPC CVR)
PPC Conversion Rate measures the percentage of ad clicks that result in a sale and helps sellers evaluate traffic quality and listing effectiveness.
Calculation:

6. Cost Per Click (CPC)
CPC measures the average amount paid for each click on an Amazon PPC ad and is influenced by keyword competition and bid strategy.
Calculation:

7. Click-Through Rate (CTR)
CTR measures the percentage of impressions that turn into clicks and helps sellers evaluate how relevant and engaging their ads are to shoppers.
Calculation:

8. Net ACoS
Net ACoS is a custom metric that factors discounts into advertising performance, helping sellers understand the real profitability of PPC campaigns after promotions are applied.
Calculation:

9. Return on Ad Spend (ROAS)
ROAS measures how much revenue is generated for every dollar spent on advertising and is commonly used to evaluate PPC performance efficiency.
Calculation:

10. Break-Even ACoS / BE ACoS
Break-Even ACoS measures the maximum ACoS a seller can afford before advertising becomes unprofitable.
Calculation:

11. Break-Even ROAS / BE ROAS
Break-Even ROAS measures the minimum ROAS required to cover all business costs without generating profit or loss.
Calculation:

After analyzing advertising metrics and PPC performance, the next step is understanding what happens after shoppers land on your listing. This is where traffic metrics become important.
Traffic metrics help sellers evaluate customer behavior, listing effectiveness, and how efficiently traffic converts into actual sales. In many cases, strong traffic with weak conversion rates can signal problems with pricing, reviews, images, or Amazon listing quality that need to be addressed before scaling spend.
Examples include:
These metrics show how well your listing converts traffic into sales. To better understand customer behavior and listing performance, let’s break down the most important traffic metrics one by one.
1. Organic Traffic
Organic Traffic measures the number of sessions generated from unpaid sources, helping sellers understand how visible their products are in Amazon search results without relying on PPC performance.
Calculation:

2. Paid Traffic (PPC Clicks)
Paid Traffic measures the number of sessions generated through Amazon advertising campaigns, including Sponsored Products, Sponsored Brands, and Sponsored Display ads.
3. Conversion Rate
Conversion Rate measures the percentage of sessions that result in a purchase and helps sellers evaluate how effectively their listing turns visitors into buyers.
Calculation:

4. Unit Session %
Unit Session % measures the percentage of sessions that result in units sold and reflects overall listing efficiency.
Calculation:

5. Organic Unit Session %
Organic Unit Session % measures how effectively unpaid traffic converts into sales and helps sellers evaluate the quality of their organic visibility.
Calculation:

6. PPC Unit Session %
PPC Unit Session % measures how efficiently paid traffic converts into product sales and is useful for evaluating PPC performance quality beyond clicks alone.
Calculation:

7. Buy Box %
Buy Box % measures the percentage of time your product owns the Buy Box, which directly impacts visibility, conversions, and overall sales potential on Amazon.
Finally, inventory metrics help sellers ensure their operations can support consistent growth, regardless of whether they rely on FBA or FBM fulfillment. Even strong listings and efficient PPC performance can quickly break down if inventory is not managed properly.
Examples include:
Without proper inventory management, even strong PPC performance cannot scale effectively.
To better understand operational efficiency and stock health, let’s break down the most important inventory metrics one by one.
1. Sellable Stock
Sellable Stock measures the total FBA inventory currently available for customers to purchase.
2. Reserved Stock
Reserved Stock represents inventory temporarily held by Amazon for operational processes such as pending orders, FC processing, or fulfillment center transfers.
3. Pending Inbound
Pending Inbound measures inventory that is currently being shipped to Amazon fulfillment centers but has not yet become available for sale.
4. Unsellable Stock
Unsellable Stock includes returned or damaged inventory that cannot currently be sold to customers.
5. Total FBA Stock
Total FBA Stock measures the total inventory associated with your Amazon account, including sellable, reserved, and inbound inventory.
6. Inventory Value
Inventory Value measures the total value of your FBA inventory based on product cost and stock levels.
7. Last 30-Day Sales
Last 30-Day Sales measures the total number of units sold for a specific SKU during the last 30 days and helps sellers evaluate recent demand trends.
8. Daily Units
Daily Units measures the average number of units sold per day based on the last 30 days of sales activity.
9. Days Coverage
Days Coverage estimates how long your current inventory will last based on recent sales velocity and is one of the most important Amazon KPIs for inventory planning.
Now that we’ve covered the core Amazon metrics categories, let’s look at a few KPIs that sellers often underestimate. While they may not receive as much attention as revenue or ACoS, these metrics can have a major impact on profitability and long-term business performance.
Coupons have become one of the most widely used tools on Amazon, second only to Amazon PPC. However, unlike PPC performance, coupon efficiency is rarely analyzed in depth.
Typical benchmarks
!Why coupon usage rate matters!
At first, a higher usage rate may seem like a positive signal. However, this often indicates over-discounting.
If your usage rate exceeds market benchmarks:
In other words, you are paying for sales you would have likely generated anyway. Additionally, every coupon redemption comes with a fixed fee, which further reduces profitability.
Calculation:

While ACoS focuses only on ad-driven revenue, TACoS provides a broader perspective on how advertising spend relates to your total business performance.
!Why TACoS matters!
ACoS alone can be misleading. For example, your ACoS may remain stable while your reliance on ads increases. TACoS reveals whether your growth is driven by:
How to interpret TACoS
Let’s break this down into practical scenarios:
Calculation:

After analyzing revenue and advertising, the next step is to evaluate product performance. This is where the refund rate becomes critical.
!Why refund rate matters!
Refunds directly impact profitability in multiple ways:
On average, sellers must sell multiple units to offset a single refund.
What this indicates
A high or increasing refund rate may signal:
As a result, refund-related losses are often much harder to recover than PPC inefficiencies because they impact revenue, inventory value, operational costs, and overall profit margins at the same time.
Calculation:

At this point, it becomes clear that PPC performance does not exist in isolation. Instead, it is influenced by multiple factors:
Tracking metrics is only the first step. The real value comes from using them to guide decisions that improve profitability and operational efficiency over time. To make these Amazon metrics actionable, sellers should focus on three key areas.
Step 1: Identify inefficiencies
Start by looking for patterns that may indicate hidden profit leaks or operational problems.
Examples include:
These trends often reveal issues that are not immediately visible through revenue alone.
Step 2: Prioritize impact
Once inefficiencies are identified, the next step is focusing on optimizations that have the greatest impact on profitability.
This may include:
In many cases, small operational improvements can significantly improve margins over time.
Step 3: Track trends over time
Finally, it’s important to analyze trends rather than isolated data points. Single-day performance can often be misleading due to seasonality, promotions, or temporary traffic fluctuations.
Instead, sellers should monitor:
This creates a more accurate picture of long-term business performance.
Amazon growth becomes much easier to understand once you stop looking at metrics in isolation. The sellers who scale successfully are usually the ones who understand how Amazon metrics influence each other across advertising, profitability, traffic, and inventory.
That’s why tracking the right Amazon KPIs matters. Metrics like TACoS, refund rate, conversion rate, inventory coverage, and profit margin often reveal operational issues long before they become major business problems.
At the end of the day, the goal is not to track more data – it’s to understand which metrics actually drive profitable decisions.
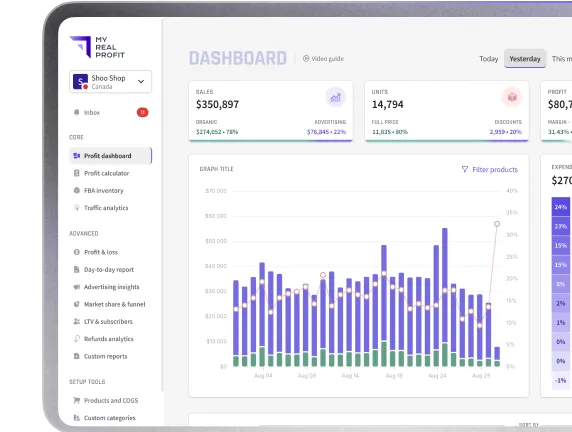
This is where My Real Profit helps. Our software gives sellers advanced, easy-to-read analytics built around real business performance, allowing you to analyze profitability, monitor PPC performance, track inventory health, and identify hidden inefficiencies from a single dashboard.
Start tracking your real Amazon profitability today with a free 21-day trial. No credit card needed, and your account will be fully connected within 72 hours.
P.S.: 8 out of 10 trial users find money-making insights before we bill them a cent.
What are Amazon metrics?
Amazon metrics are performance indicators that help sellers measure sales, profitability, advertising efficiency, traffic quality, and inventory health. These Amazon KPIs help sellers make data-driven decisions to improve long-term business performance.
Why are Amazon’s KPIs important?
Amazon KPIs are important because they help sellers understand what is actually driving profit and growth. Tracking the right metrics allows sellers to identify inefficiencies, improve PPC performance, optimize inventory management, and make better operational decisions.
What is the difference between ACoS and TACoS?
ACoS (Advertising Cost of Sales) measures ad spend relative to PPC sales only, while TACoS (Total Advertising Cost of Sales) measures ad spend against total revenue, including organic sales. TACoS helps sellers understand the broader impact of advertising on business growth.
How do Amazon metrics affect profitability?
Amazon metrics directly influence profitability because they reveal hidden costs and operational inefficiencies. For example, high refund rates, excessive discounts, poor PPC efficiency, or rising storage fees can significantly reduce margins even when revenue is growing.
Why is the refund rate an important Amazon KPI?
Refund rate is important because refunds reduce revenue, increase operational costs, and may signal issues with product quality or listing accuracy. A rising refund rate can negatively impact overall profitability and customer satisfaction.
How can sellers use Amazon metrics to make better decisions?
Sellers should use Amazon metrics to identify inefficiencies, prioritize optimizations, and monitor long-term trends. Instead of analyzing isolated numbers, experienced sellers evaluate how metrics interact across profitability, PPC performance, traffic, and inventory management.
How often should Amazon sellers review their KPIs?
Amazon sellers should monitor core Amazon KPIs daily or weekly, depending on the metric. PPC performance, sales trends, and inventory levels often require daily tracking, while profitability, TACoS, and refund trends are typically more valuable when analyzed over weekly or monthly periods to identify long-term patterns.
Can strong sales still hide poor business performance?
Yes. Revenue growth alone does not always mean a business is healthy. Sellers can increase sales while reducing margins, overspending on PPC, or accumulating high refund and storage costs. This is why Amazon metrics should always be analyzed together rather than in isolation.