


June 28, 2023 ● 9 min read
Amazon Seller Reports Guide: All Reports Explained With Links










Most Amazon sellers believe they understand their customer retention strategy. However, retention is often evaluated using average lifetime value, which can hide important behavioral shifts beneath the surface. To understand retention correctly, sellers need to track the right Amazon metrics across acquisition, repeat purchases, and profitability.
When all customers are analyzed together, high‑value repeat buyers and one‑time purchasers become blended into a single metric. As a result, meaningful changes in customer behavior, such as whether a new campaign attracts loyal customers or short‑term discount buyers, can go unnoticed.
Cohort-based Amazon LTV solves this problem by grouping customers based on when and how they first purchased. This approach makes it possible to observe retention patterns over time and understand how business decisions influence long‑term customer value.
In this article, we will walk you through three practical use cases that demonstrate why cohort-based LTV is the most reliable method for analyzing retention, using real examples from TOP brands working with My Real Profit.
Retention is one of the most important drivers of long‑term profitability for Amazon brands. However, many sellers evaluate retention using only average lifetime value.
The problem is that average LTV blends all customers together: first‑time buyers, repeat purchasers, and long‑term subscribers. When this happens, important behavioral changes remain invisible. You lose the ability to distinguish loyal subscribers from one-time deal seekers.
If your new campaign brings in lower-quality traffic, or if your product experience starts to decrease retention, those signals get buried in the average number. What looks like “stable” performance may actually be hiding a quiet decline in repeat purchases, reducing your margins over time. Without cohorts, you’re flying blind, making decisions on vanity metrics instead of real customer behavior.

Cohort-based Amazon LTV separates customers by the month of their first purchase and tracks how each group behaves over time. This makes it possible to see whether newer customers are retaining at the same level as previous ones.
Even small declines can add up quickly when applied across thousands of orders.
Track cohort-based Amazon LTV monthly to understand:
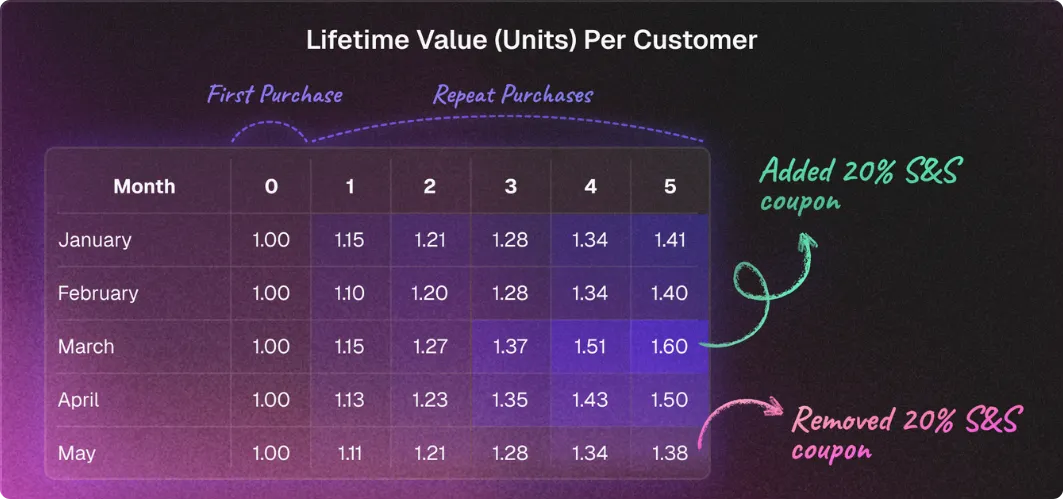
In March 2025, customers acquired with a 20% Subscribe & Save coupon reached a 6‑month LTV of 1.6 units.
In May 2025, after the coupon was removed, the 6‑month LTV dropped to 1.38 units.
That’s a 14% decline in retention value.

On the surface, overall sales looked stable. Average LTV across the account barely changed.
But cohort analysis revealed that newer customers were purchasing less frequently after their first order.
Without cohort-based LTV, this decline would have been missed — and the business would only feel the impact months later through slower repeat revenue.
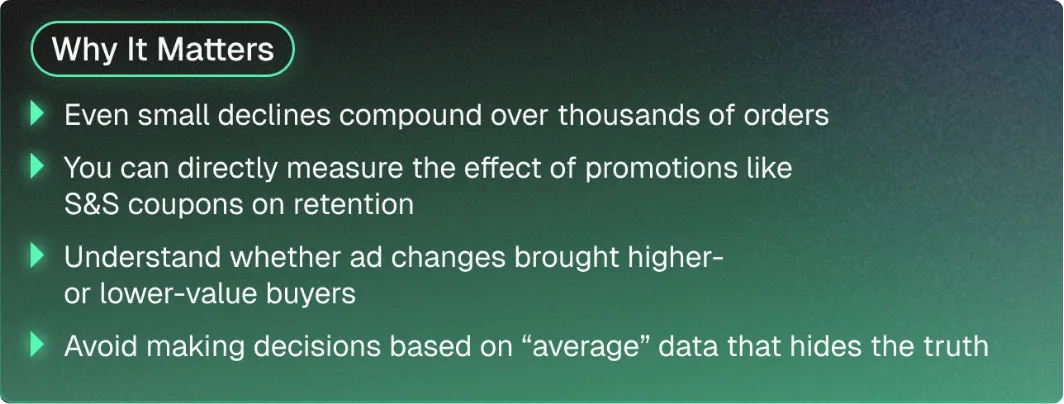
Whenever you update your packaging, refresh your brand visuals, or adjust Subscribe & Save coupons, it’s important to understand whether these changes actually improve customer retention strategy.
The problem is that average LTV blends all customers together, and when this happens, important behavioral changes remain invisible, making it hard to tell whether your brand refresh is driving real long-term value or just short-term spikes.

One of the most reliable ways to evaluate this is through cohort-based LTV analysis. By comparing the lifetime value of customers acquired before and after a change, you get a clear before-and-after view of its long-term impact.
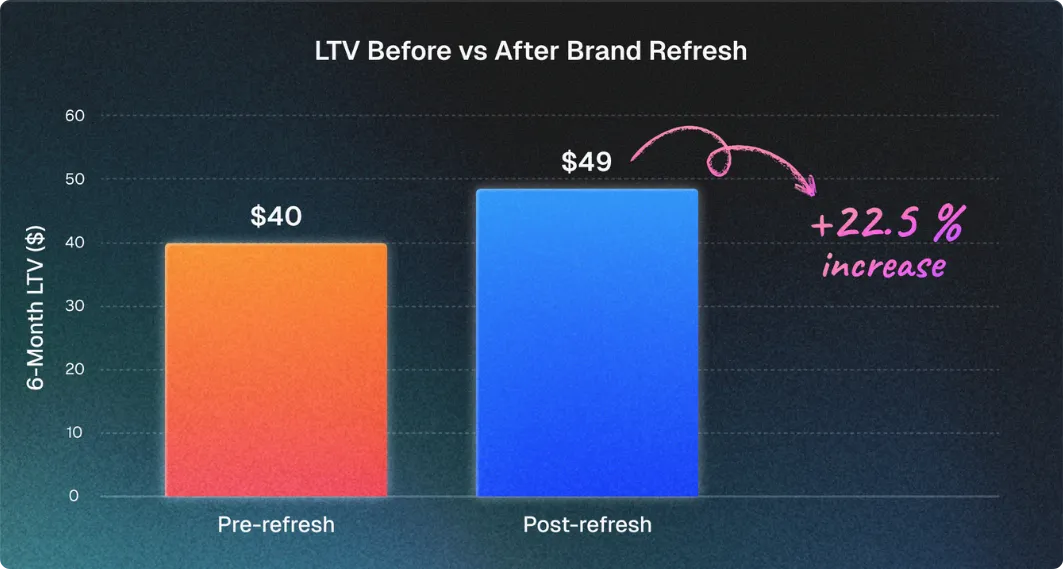
Let’s say you updated your packaging in May 2025. Customers acquired before the change had a 6-month LTV of $40, while customers acquired after the update had a 6-month LTV of $49. That’s a +22.5% increase in retention value.

This uplift might not be visible if you’re only looking at average LTV across all customers. But cohorts reveal the true story, allowing you to tie retention gains directly to a specific change.
Why this matters:
When you’re running frequent tests or product iterations, cohort-based Amazon LTV gives you clear answers to the audience response.

Most brands evaluate ad campaigns based on ACoS or CAC. But what if two campaigns bring in the same amount of revenue, yet one brings long-term customers while the other attracts one-time buyers?
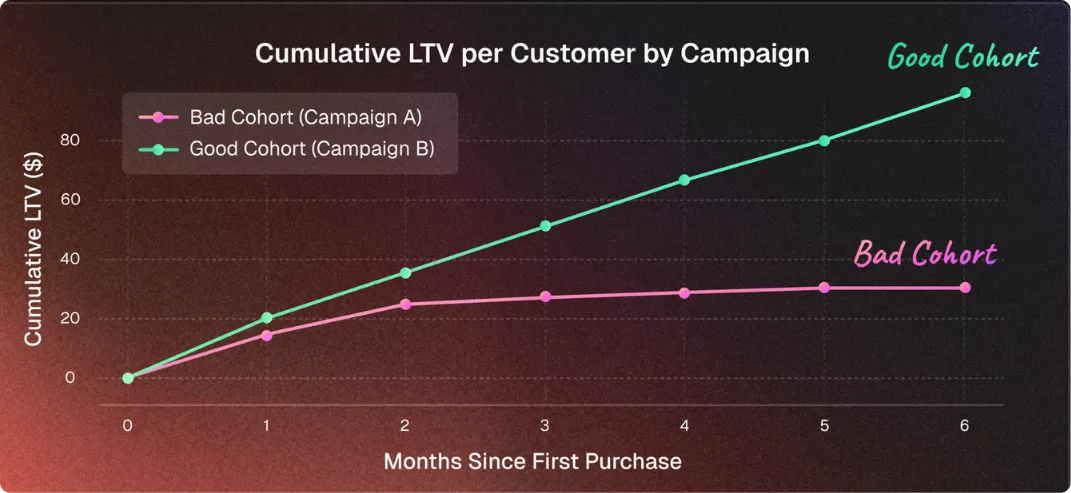
The problem is that average LTV blends all customers. When this happens, important behavioral changes remain invisible.
What cohort analysis gives you is that, instead of looking only at short-term returns, it shows you how long customers actually stay, depending on which campaign brought them in.

Ad campaigns often attract different customers depending on buyer behavior on Amazon. Some creatives attract one-time discount hunters, others bring in sticky subscribers. With cohorts, you can measure which campaigns produce customers who actually stay longer.
Two campaigns might look similar at first glance:
If you looked only at average LTV or ACoS, one of the key Amazon advertising KPIs, these campaigns might seem equally profitable. But cohort data shows a different story: customers from Campaign B are far more valuable long-term. That campaign should get more budget, even if the CAC is slightly higher.

Track retention by acquisition channel to understand:
When your ad dollars are tied to real LTV, not vanity metrics, you’ll be able to scale smarter and drive sustainable growth.
Whether you’re running Amazon ads, testing new pricing, or launching new products, retention is your growth engine, and the only reliable way to measure true retention is through cohort-based LTV.
At My Real Profit, we’ve built advanced tools to help Amazon sellers unlock their way to profit without the guesswork:
If you want to turn raw data into a profitable strategy and build a brand that lasts, cohort LTV is where it starts.
Ready to see cohort-based LTV in action?
1. What is cohort-based LTV?
Cohort-based LTV tracks how groups of customers acquired in the same time frame behave over time. Instead of averaging all buyers together, it reveals how different acquisition cohorts retain, repeat, and generate value. It’s essential for understanding whether changes in campaigns, pricing, or packaging actually lead to better long-term customers.
2. How is cohort LTV different from average LTV?
Average LTV combines all customers into a single number, hiding differences between loyal repeat buyers and one-time purchasers. Cohort LTV shows retention curves for each group separately, helping brands spot declines, validate growth strategies, and avoid misleading conclusions based on averages.
3. When should brands use cohort-based Amazon LTV analysis?
Cohort LTV should be used when testing new campaigns, launching new packaging, adjusting Subscribe & Save discounts, or evaluating customer quality across acquisition sources. It gives a clear before/after view of any strategic change and reveals whether you’re attracting customers who stay.
4. Why is it dangerous to only look at average LTV?
Because it hides retention declines. If your product experience or ad targeting changes and brings in lower-quality customers, average LTV can stay flat while newer cohorts churn faster, and cohort LTV lets you catch it early.
5. Can I use cohort LTV to compare ad campaigns?
Yes. Campaigns that look similar in terms of ACoS or CAC can bring in completely different types of buyers. With cohort tracking, you can compare how long customers from each campaign actually stay, and shift budget to ads that drive higher-value retention.
6. What timeframes should I use to evaluate retention?
For most CPG brands, 6-month and 12-month LTV windows are ideal. Shorter windows (e.g., 2–3 months) are useful for fast feedback on S&S promotions or aggressive discounts, while longer windows show deeper loyalty patterns.
7. Can cohort LTV help with subscription performance?
Absolutely. It can show if Subscribe & Save offers are actually increasing long-term retention or just pulling in short-term buyers who cancel quickly. You can track if coupon adjustments lead to meaningful LTV gains over time.
8. How often should I monitor cohort trends?
Monthly cohort reviews are best for spotting shifts early. If you’re testing frequently (e.g., creatives, pricing, S&S levels), reviewing biweekly can provide even faster feedback loops to optimize retention.
9. What metrics should I track alongside cohort LTV?
Look at repeat rate, average order count, revenue per customer, and churn by cohort. Combine this with CAC and contribution margin to evaluate how profitable each group really is over time, not just in the first 30 days.
10. How does My Real Profit support cohort-based LTV tracking?
My Real Profit automatically groups customers into cohorts by acquisition month and visualizes their retention over time. You can filter by campaign, product, or channel, and instantly see if your changes are attracting better customers or weakening your core base.