


June 28, 2023 ● 9 min read
Amazon Seller Reports Guide: All Reports Explained With Links


Seasonality is one of the most predictable and most overlooked aspects of selling on Amazon. The platform’s demand curves follow clear, repeating patterns year after year. Sellers who prepare before the wave starts not only capture more sales but also avoid overpaying for traffic when competition peaks.
The key is knowing when the spike will hit in your niche, how long it will last, and what adjustments to make at each stage.
Amazon’s Category Insights report provides exactly this visibility, but it’s often buried in Seller Central and underused by experienced sellers.
This guide breaks down:
What Category Insights is and how to find it
How to interpret the data for your niche
Season-by-season actions to maximize Q4 results without overspending
Most sellers react to demand rather than anticipating it. They increase ad spend after noticing sales lift — at the same time everyone else is doing the same. This reactive approach comes with two main problems:
Higher acquisition costs — PPC auctions are already inflated by the time you act.
Inventory strain — late ordering forces rushed replenishments or stockouts.
By preparing 1–3 months ahead of peak season, you can:
Secure manufacturing slots before they fill
Lock in lower ad CPCs
Enter the peak with established ranking instead of fighting from page two
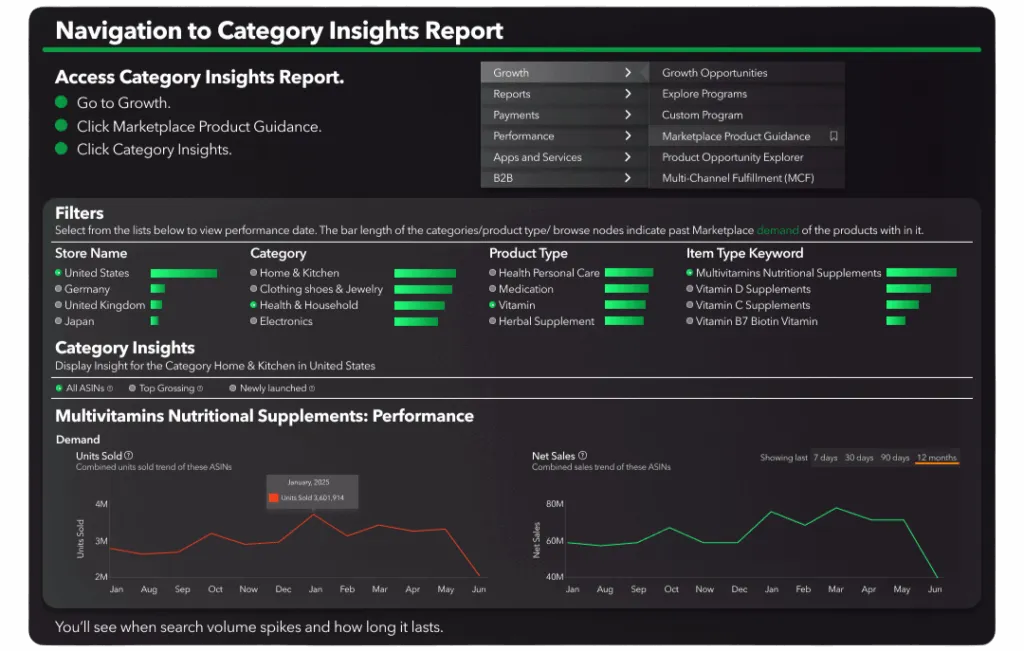
The Category Insights report is located in Seller Central under Growth. To access it:
Go to Growth in the top navigation bar
Select Marketplace Product Guidance
Click Category Insights
From there, you can filter by:
Store Name (US, UK, DE, JP)
Category (Home & Kitchen, Health & Household, etc.)
Product Type (e.g., Health Personal Care, Medication, Vitamins)
Item Type Keyword (niche-specific keywords within the product type)
Each filter combination will show:
Demand trends — search volume across time
Net sales trends — historical sales patterns
When you open a report for your niche, you’ll see two core graphs:
Demand (Sold-to) — The number of units sold within the selected category/product type. This tells you when customers start searching and how quickly demand builds.
Net Sales — The total value of sales for the same products. This helps you see monetary peaks and whether they align with unit demand.
Look at:
The start of the curve (the earliest sign of increased searches)
The duration of the spike (how long demand stays elevated)
The decline (when it returns to baseline)
Using the report for Multivitamins Nutritional Supplements in the US:
Demand begins rising in late December/early January (New Year’s health resolutions)
Another noticeable spike occurs mid-year around summer prep
Sales value tracks closely with demand but also shows micro-spikes from promotions
This kind of pattern helps you plan ad ramp-ups, content refreshes, and inventory allocation.
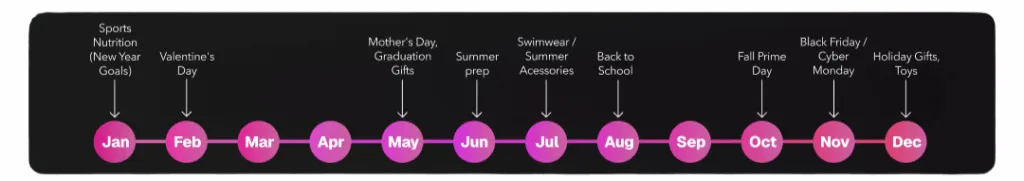
Amazon’s seasonality patterns are surprisingly consistent year over year. For example:
January: Sports Nutrition, New Year Goals
February: Valentine’s Day
March–April: Mother’s Day, Graduations, Gifts
June–July: Summer Prep
August: Swimwear, Summer Accessories
September: Back to School
October: Fall Prime Day
November: Black Friday / Cyber Monday
December: Holiday Gifts, Toys
Even if your category isn’t directly tied to these events, you’ll likely see ripple effects in demand.
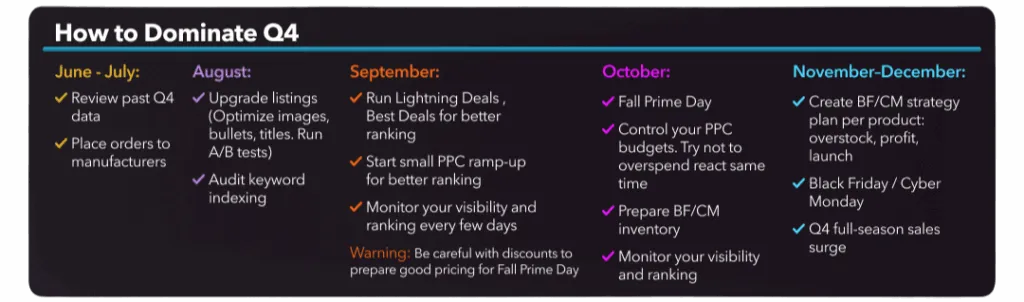
The final quarter of the year is where most sellers focus their energy — but preparation starts much earlier. Using Category Insights, you can map out a month-by-month operational plan.
Review past Q4 data: Identify which SKUs drove the most profit, not just revenue.
Place orders with manufacturers: Secure production slots before they’re at capacity.
Audit keyword indexing: Ensure all top seasonal keywords are indexed before ad ramp-up.
Upgrade listings: Refresh images, bullet points, and titles; run A/B tests.
Optimize for mobile viewing: Many Q4 shoppers browse on phones — check your mobile PDP.
Run Lightning Deals & Best Deals: Use deals to push ranking ahead of Q4.
Begin small PPC ramp-up: Start 3–4 weeks before the peak to establish ranking at lower CPCs.
Monitor visibility and ranking every few days: Adjust bids and budgets proactively.
Pricing strategy warning: Secure competitive pricing now to avoid overpaying for Prime Day ads.
Fall Prime Day: Treat it as both a sales event and a ranking booster for November.
Control PPC budgets: Increase only enough to maintain position; avoid CPC spikes.
Prepare inventory for BFCM: Allocate enough units to sustain aggressive promotions.
Continue ranking monitoring: Q4 competition is dynamic — adjust faster than competitors.
Execute BFCM strategy: Plan product-specific offers for Black Friday/Cyber Monday.
Balance overstock risk with profit: Don’t flood FBA with slow movers.
Launch final wave of ads: Support fast movers with extra budget.
Capitalize on post-BFCM surge: Many shoppers buy gifts in early December at full price.
Don’t wait for the spike to start
The best time to capture seasonal traffic is before the market heats up. If you only react once the search volume or interest starts climbing, you’re already competing with everyone else who noticed the same spike.
Aim to build visibility early so you’re ranking and converting when the surge actually arrives. This means watching for leading indicators, not just lagging ones.
Budget for early investment
Match inventory to realistic sell-through
Seasonality can create temptation to overstock, but that comes with storage, discounting, and cash flow risks.
Lean on historical Category Insights and sales data to model realistic sell-through rates. This lets you hit the sweet spot: enough supply to meet peak demand without being left with excess inventory when the season ends.
While many sellers rely on “gut feel” or last year’s sales logs, Category Insights offers:
Aggregated marketplace data — not just your own account history
Granular keyword/category breakdowns
Visibility into competitor-driven shifts
For brands in competitive categories, the difference between reacting late and acting early can mean:
Lower TACoS from established ranking before CPC inflation
Higher organic share during peak shopping days
Reduced storage fees from tighter inventory cycles
Seasonality is predictable, but only if you track it with the right tools. Amazon’s Category Insights report removes guesswork by showing you exactly when customers start searching and buying in your niche.
By combining this data with disciplined operational planning — from June through December — you can ride the wave instead of chasing it.
The earlier you act, the less you’ll spend to achieve the same results.
If you want to forecast seasonality, track real-time results, and stop guessing → Try My Real Profit
Try My Real Profit for free and start making the most out of your Amazon data today!