Day-to-day

Amazon KPI Dashboard for Sellers

All your core Amazon KPIs in one table: sessions, conversion rate, PPC, and margin. See what changed and why.

We’re part of:

Amazon - Markerplace developer council Amazon - Seller central partner network

Trusted by

1000+

industry leaders

Best Seller in Deodorants
Salt & Stone

100%

NTB accuracy

Faster Insights

Best Seller in Sea Vegetables
True Sea Moss

Subscriber Growth

40%

NTB increase

Top agency
Trivium

100%

Auto Reporting

50hrs+

Saved

Best Seller in Home & Kitchen
CGK Linens

-18%

Wasted ad spend

10x

Decision Speed

Best Seller in Headbands
Kitsch

5hrs+

Saved Daily

100%

Profit Clarity

Best Seller in Flushable Wipes
Good Wipes

Optimization

100%

Branded view

Top agency
TripleLine

100%

Centralized Data

Reporting Speed

Best Seller in Cutting Boards
Royal Craft Wood

+13%

Gross margin

−22%

Refund reduction

Best Seller in Stick Umbrellas
UEP

Efficiency Gain

100%

Cost Control

What is the Amazon KPI dashboard?

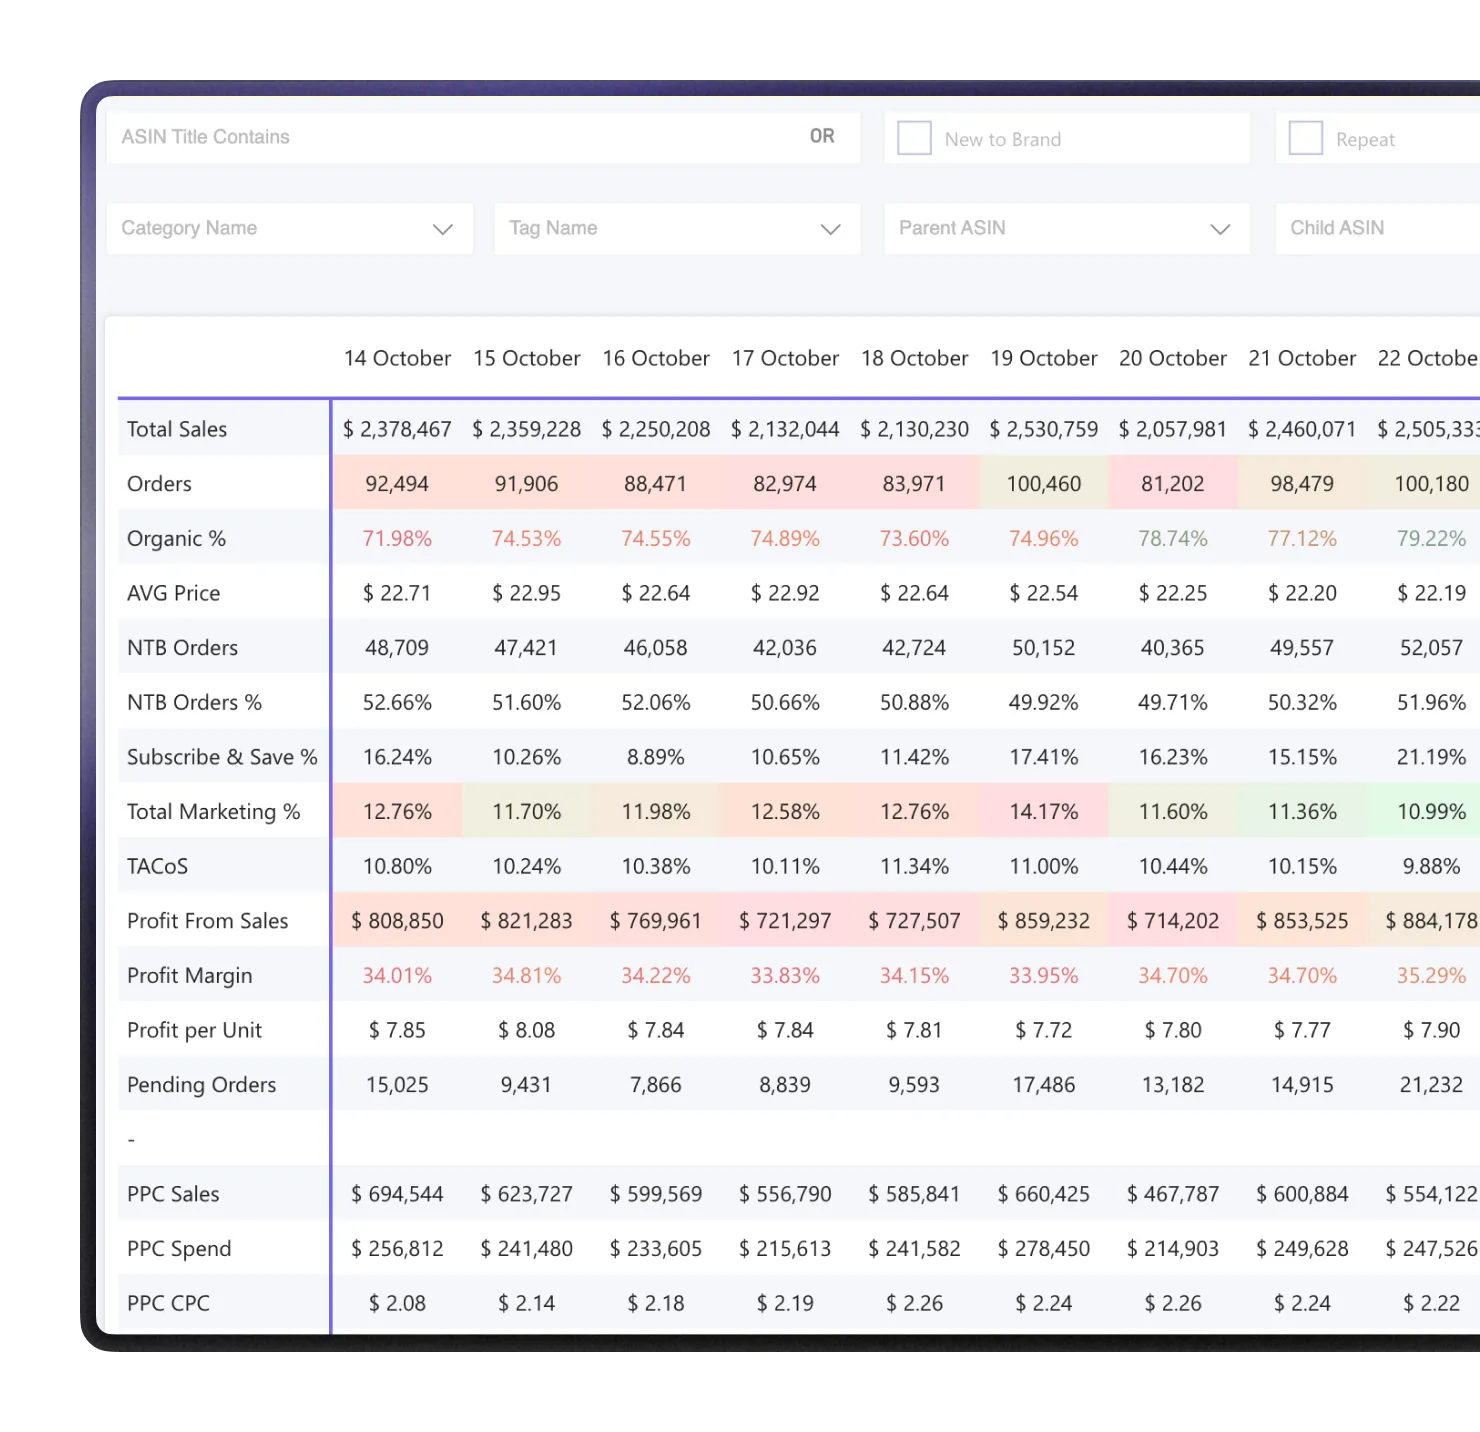
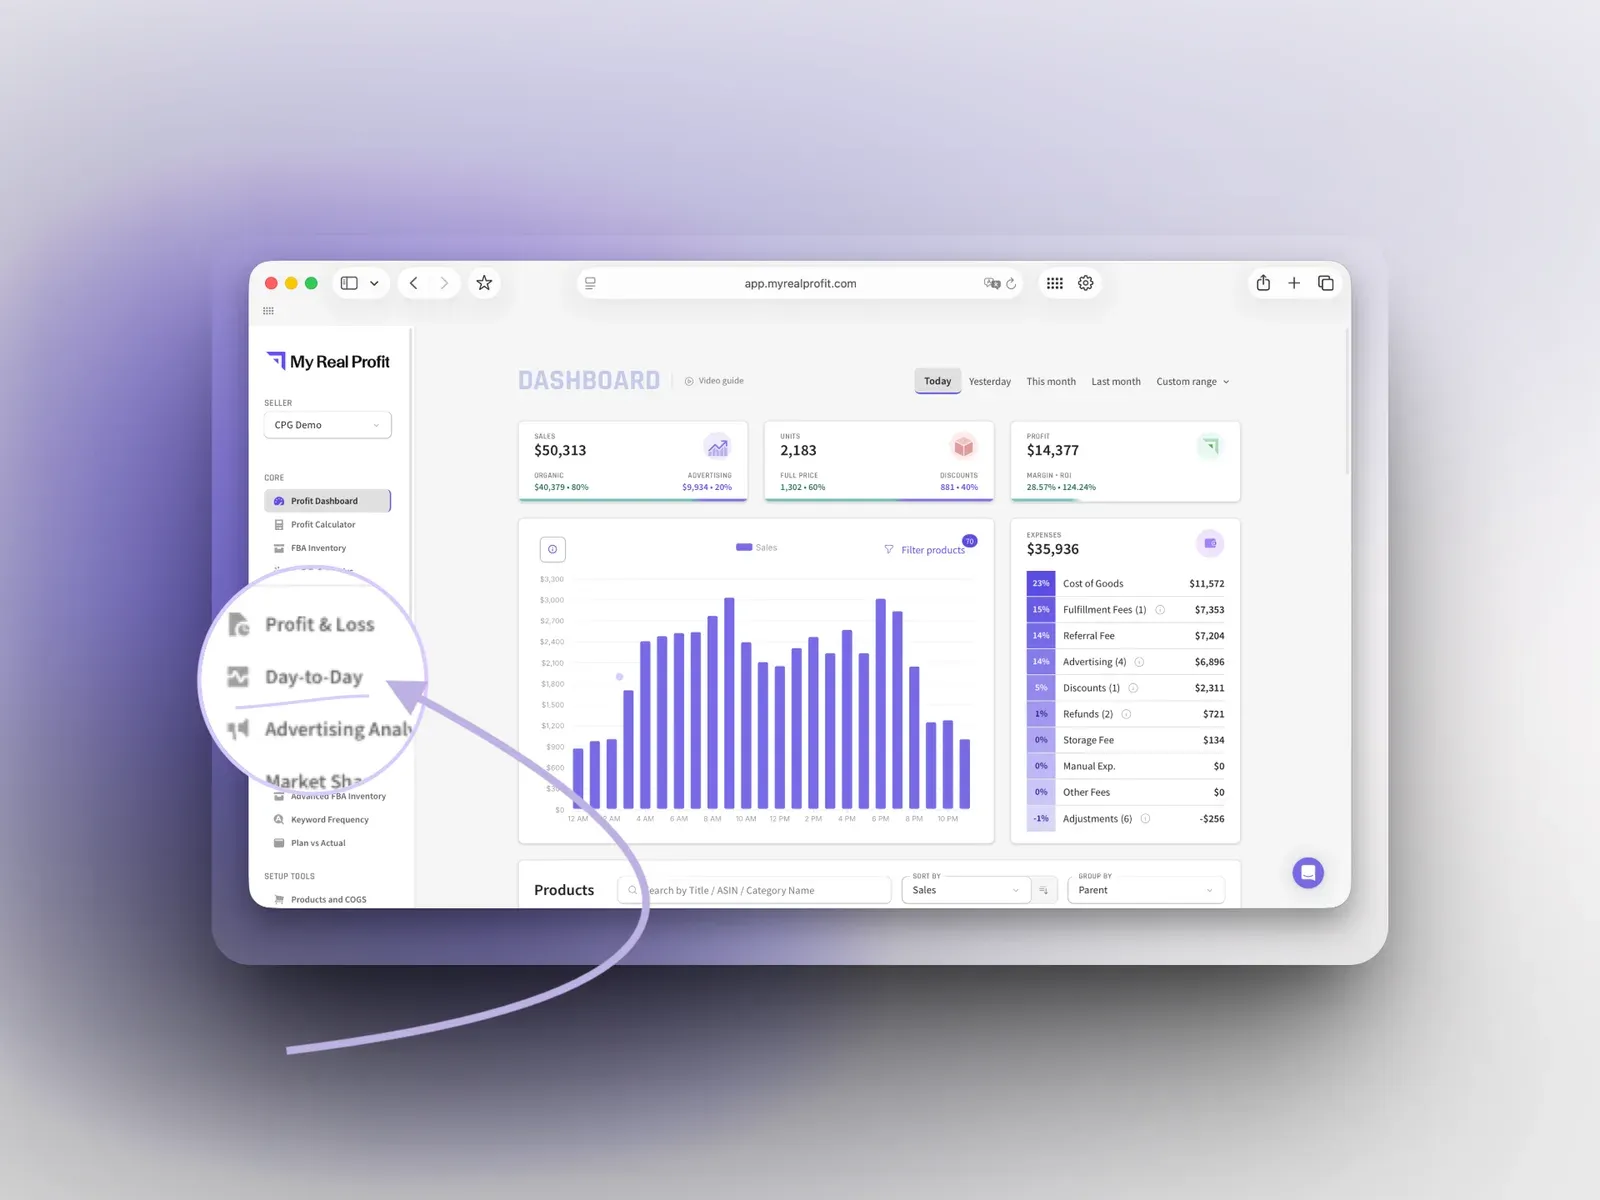
The key performance indicators dashboard inside MyRealProfit is the Day-to-Day report: one daily table that puts your main Amazon KPIs side by side. Sales, profit, advertising, and conversion all sit in one view, for the whole account or a single product.

Instead of a number sitting alone, you see it next to every metric that moves it. So you can read your whole account at a glance and spot what changed on any day or week, and why.

Features

How the dashboard
helps you

All KPIs in one
heatmap table

Sales, Marketing, Profit, and PPC & conversion metrics sit side by side: Total Sales, TACoS, Profit Margin, ROI, Conversion Rate %, and more.

The weekly view color-codes each cell, so strong and weak weeks stand out.

The reason behind
every number

Profit, units, PPC spend, conversion, and price are on the same row over time.

So you can tell if profit moved because of ads, conversion, price, or the season.

Driver analysis with
the spread metric

A second page color-codes every cell and adds Spread (average price minus CPA).

It shows if a higher price makes customer acquisition cheaper or more expensive.

Product-level view,
down to the ASIN

Filter by product, category, tag, or ASIN, split New-to-Brand vs Repeat, track daily BSR, chart any metric, and export to Excel.

(New-to-Brand needs the CPG package; BSR shows on live accounts only.)

Trend and
comparison views

Use 14 days by day for the trend, and 6 weeks by week to compare weeks.

Key features of the tool

The Amazon KPI report is one report inside MyRealProfit. When a number moves and you want to dig in, the platform has a report for it:

  1. 1 Profit Dashboard

    Live sales and profit for your whole account, so you know today's numbers before the day ends.

  2. 2 Profit & Loss

    A full Amazon profit and loss statement that removes fees, refunds, VAT, and COGS, so your profit line is the real one.

  3. 3 Advertising Analytics

    Go deep on Amazon advertising analytics, down to hourly performance, when TACoS or ACoS moves on the dashboard.

  4. 4 LTV & Subscriptions

    See what an Amazon customer lifetime value is worth over a year, not just the first order, plus Subscribe & Save retention.

  5. 5 SQP Market Share & Funnel

    Find out if a keyword lost sales because demand dropped or because a competitor took your share.

  6. 6 FBA Inventory

    Amazon inventory management helps to spot a drop in your KPIs, which is never a surprise stockout.

How to use the Amazon KPI dashboard

Here is the full flow, from sign-up to your first KPI view.

Step 1. Create your account

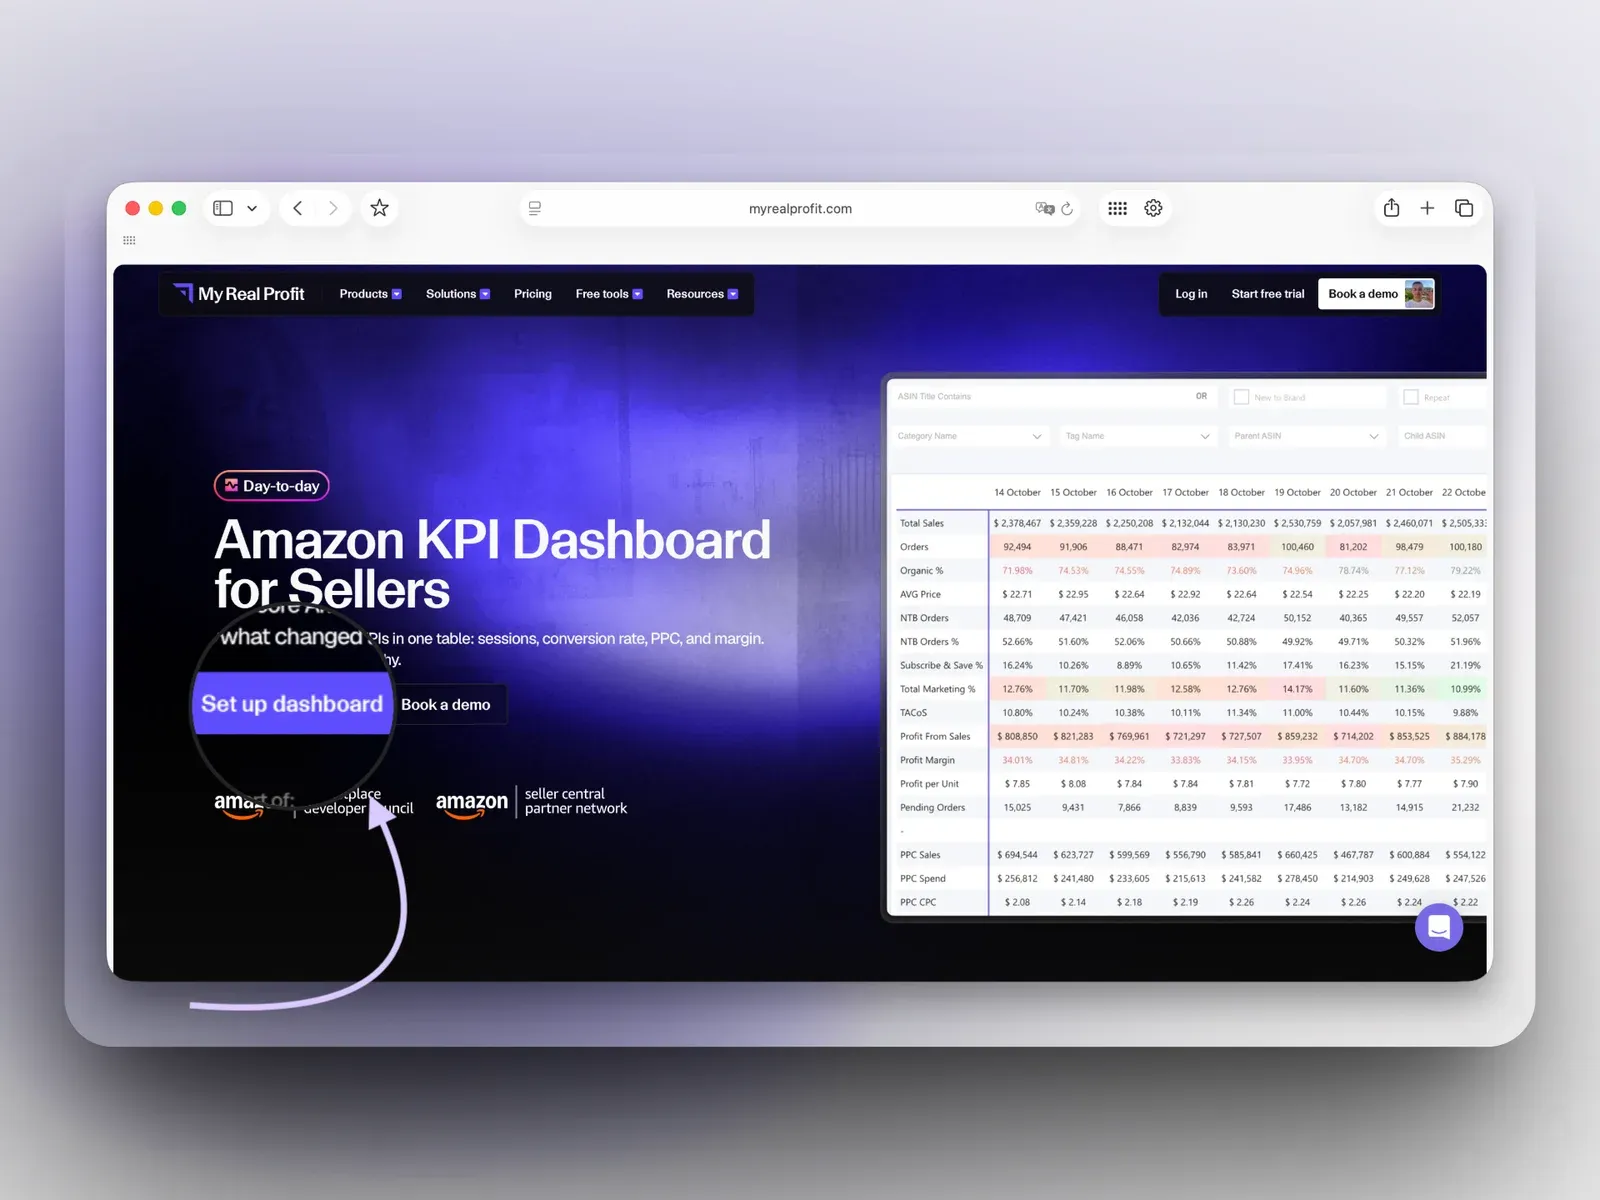
Click the 'Set up dashboard' button at the top of the page. Fill in the form and choose your business type. No credit card is required.

MyRealProfit with the Set up dashboard button

Step 2. Connect your Amazon account

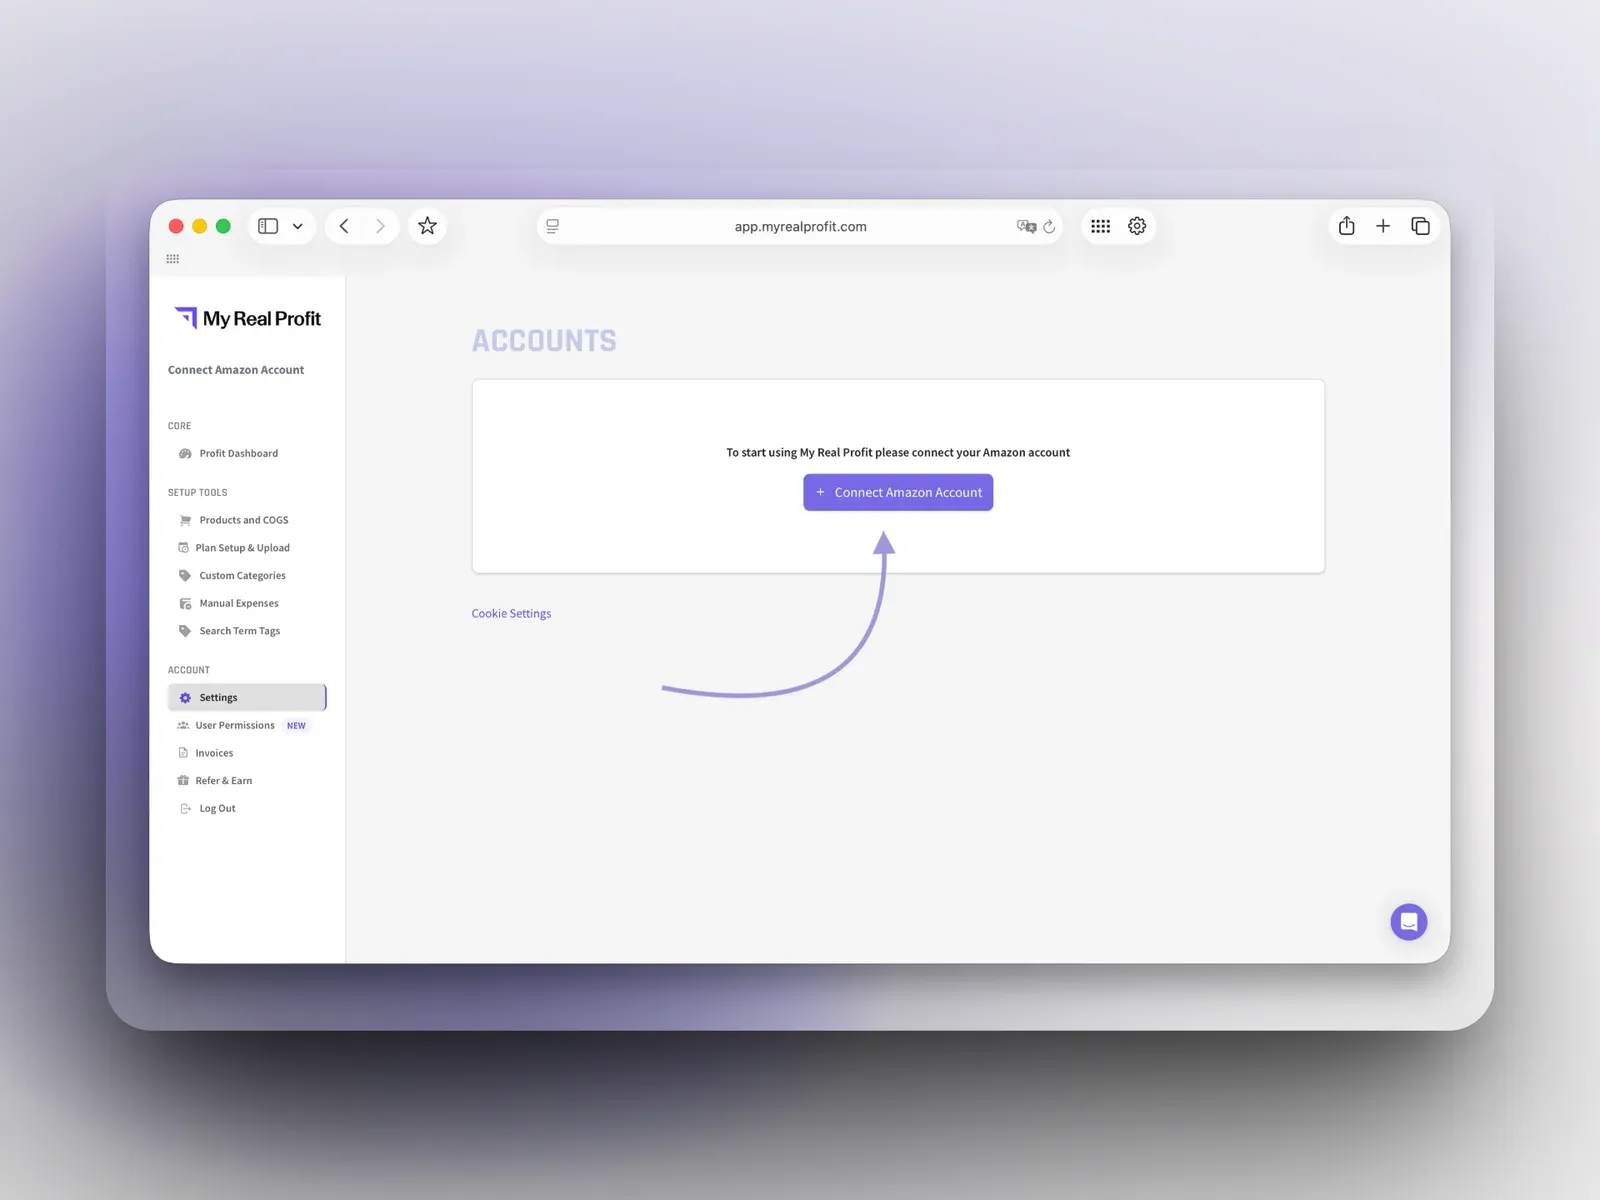
On the Accounts page, click 'Connect Amazon Account' and connect by region (North America, Europe, or Far East). This takes under five minutes.

Connect Amazon Account page in MyRealProfit

Step 3. Get the KPI Day-to-Day report

Your data imports automatically and you land on the Profit Dashboard (full reports are ready in 2 to 3 days). In the left menu, under Advanced, click Day-to-Day. This is your Amazon KPI dashboard.

Day-to-Day Amazon KPI dashboard

See it in the video below. In the walkthrough, you can:

  • Set the period (Day, Week, or Month) and switch to Week for the heat-map colors.
  • Scroll down for sessions and conversion rate, and view the data by category, parent ASIN, child ASIN, or chart.
  • Open the Driver Analysis tab for color-coded cells and the Spread metric.

Who is the dashboard for?

Amazon sellers

Check every morning if sales, traffic and margin are on track, before changing ads or prices.

CPG and repeat-purchase brands

See New-to-Brand vs Repeat and Subscribe & Save next to daily sales.

Agencies

Track the same KPIs for every client, without building a new report each time.

Founders and brand managers

Get a quick view of account health, without waiting for a weekly report.

Your Amazon KPIs in one daily view

An Amazon business has many KPIs across several reports, which makes decision-making slow. The Amazon KPI dashboard puts every core KPI into a single daily, color-coded view, based on your real Amazon data. Connect your account, wait for the data to load, and start each day knowing what changed and why. MyRealProfit has a 21-day free trial, and no credit card is required.

FAQ

Every question, answered

Most reports refresh every 30 minutes. Financial reports also reconcile Amazon fees, VAT, refunds, and COGS, so you always see real profit after Amazon’s costs.
The dashboard pulls up to 24 months of sales and fees, and 60 days of PPC data. During the free trial you get two months of history (LTV data loads more). Your full history loads after you move to a paid plan.
Yes. You can connect and manage several Amazon accounts in one workspace, with no limit on the number. Each region (North America, Europe, or Far East) connects once and pulls all its marketplaces.
No. It only reads your data. It does not touch your listings, prices, or settings.
Not yet. The dashboard supports Amazon Seller Central for now.
Yes. MyRealProfit is an official Amazon developer, and your data is stored on Amazon Web Services (AWS) with enterprise-grade encryption.
  • Our insights
  • +
  • Your data
  • =
  • More Profit
Only 2 clicks stand between you
and data you've never seen before

Book a free demo call or start your free trial today and see
exactly how it works for your business.

  • No long-term contracts
  • No setup fees
  • No credit card required