We’re part of:
Trusted by
industry leaders
100%
NTB accuracy
3×
Faster Insights
2×
Subscriber Growth
40%
NTB increase
100%
Auto Reporting
50hrs+
Saved
-18%
Wasted ad spend
10x
Decision Speed
5hrs+
Saved Daily
100%
Profit Clarity
3×
Optimization
100%
Branded view
100%
Centralized Data
5×
Reporting Speed
+13%
Gross margin
−22%
Refund reduction
4×
Efficiency Gain
100%
Cost Control
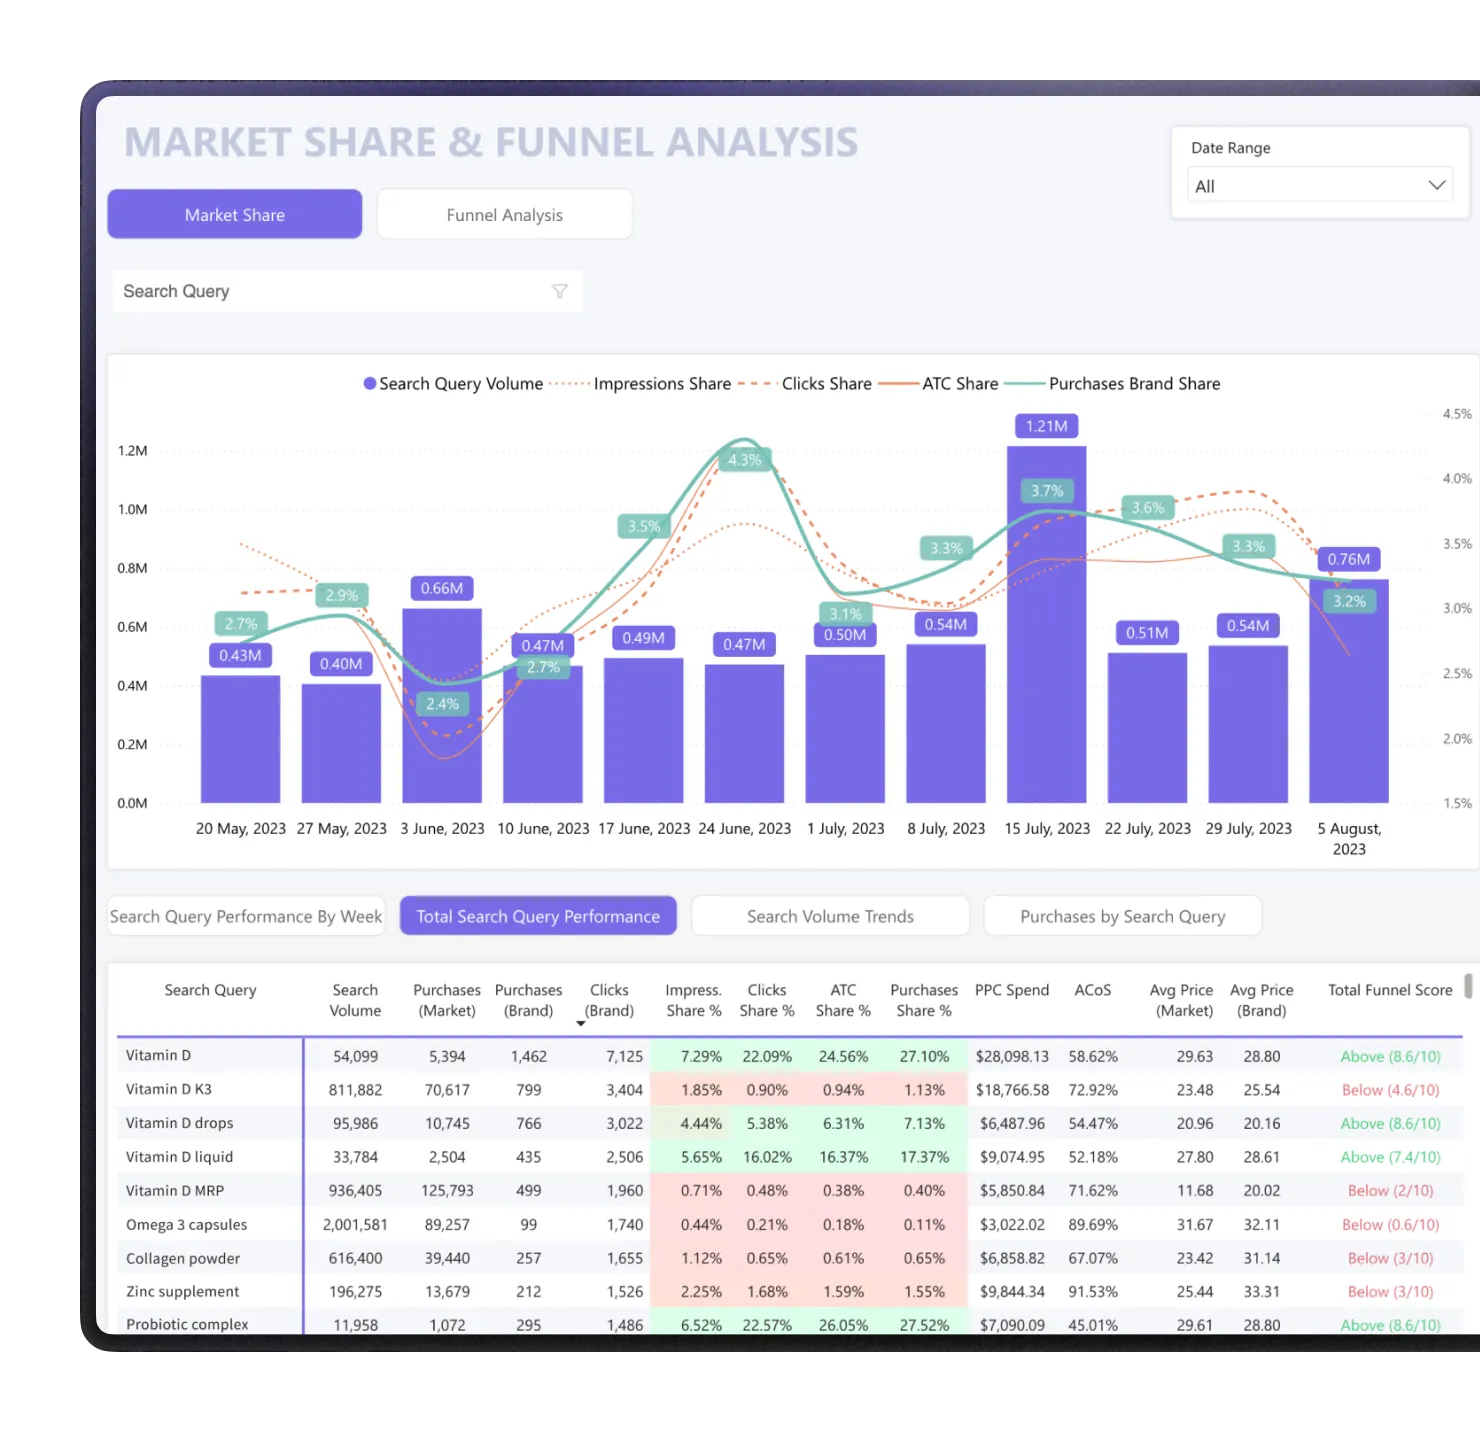
The Amazon Search Query Performance report (SQP) in MyRealProfit is our Market Share & Funnel report. It shows how your ASINs win or lose share on the keywords your customers actually search.
For each keyword, you see your impression share, click share, ATC Share, and purchase share against the total search volume, with your PPC on the same row.
One score per keyword from 0 to 10 that combines CTR, add-to-cart rate, cards-to-purchases, and conversion rate versus the market.
A score of 5 means you match the market, green is above, red is below. So you see which step is below the market at a glance.
Each keyword row shows PPC Spend and ACoS next to your share metrics, so you see where ad spend buys visibility and where it does not.
The Compare tab puts this period next to the last one and flags keywords where your clicks or impression share fell, and whether the market moved too.
So you catch losses before they hit revenue or organic rank.
Break performance down by account, Parent ASIN, Child ASIN, or keyword.
When several of your products chase the same keyword, you see which one wins the share and whether your PPC spend goes to your best product.
Avg Price (Market) sits next to Avg Price (Brand) on every keyword row.
So a low add-to-cart rate on a higher price reads as normal, not a content problem, before you change the listing.
The Amazon Search Query Performance report is one report inside MyRealProfit. When a keyword loses share, and you want the full picture, the platform has a report for it:
Live sales and profit for your whole account, so you know today's numbers before the day ends.
A full Amazon profit and loss statement that removes fees, refunds, VAT, and COGS, so your profit line is the real one.
Go deep on Amazon advertising analytics, down to hourly performance, when ACoS on a keyword moves.
All your core Amazon KPIs in one daily, color-coded table, so you spot what changed across the account.
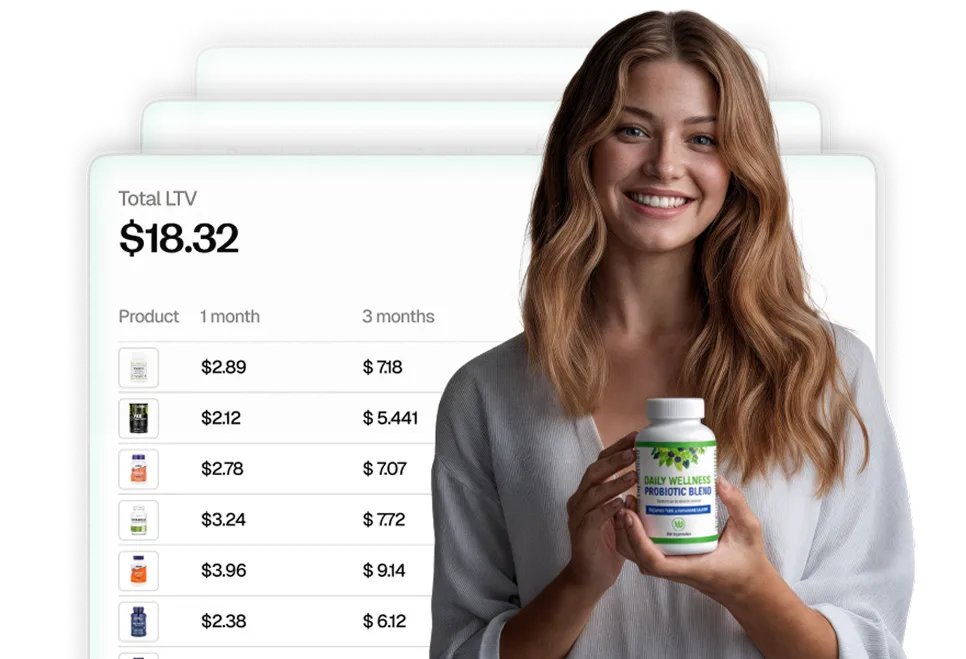
See what an Amazon customer lifetime value is worth over a year, not just the first order, plus Subscribe & Save retention.
Amazon inventory management that forecasts stock, so a keyword that wins more sales never ends in a surprise stockout.
MyRealProfit reads your data through the official SP-API and Advertising API, updates automatically, and only reads data, so it never changes your listings or prices.
Here is the full flow, from sign-up to your first keyword view.
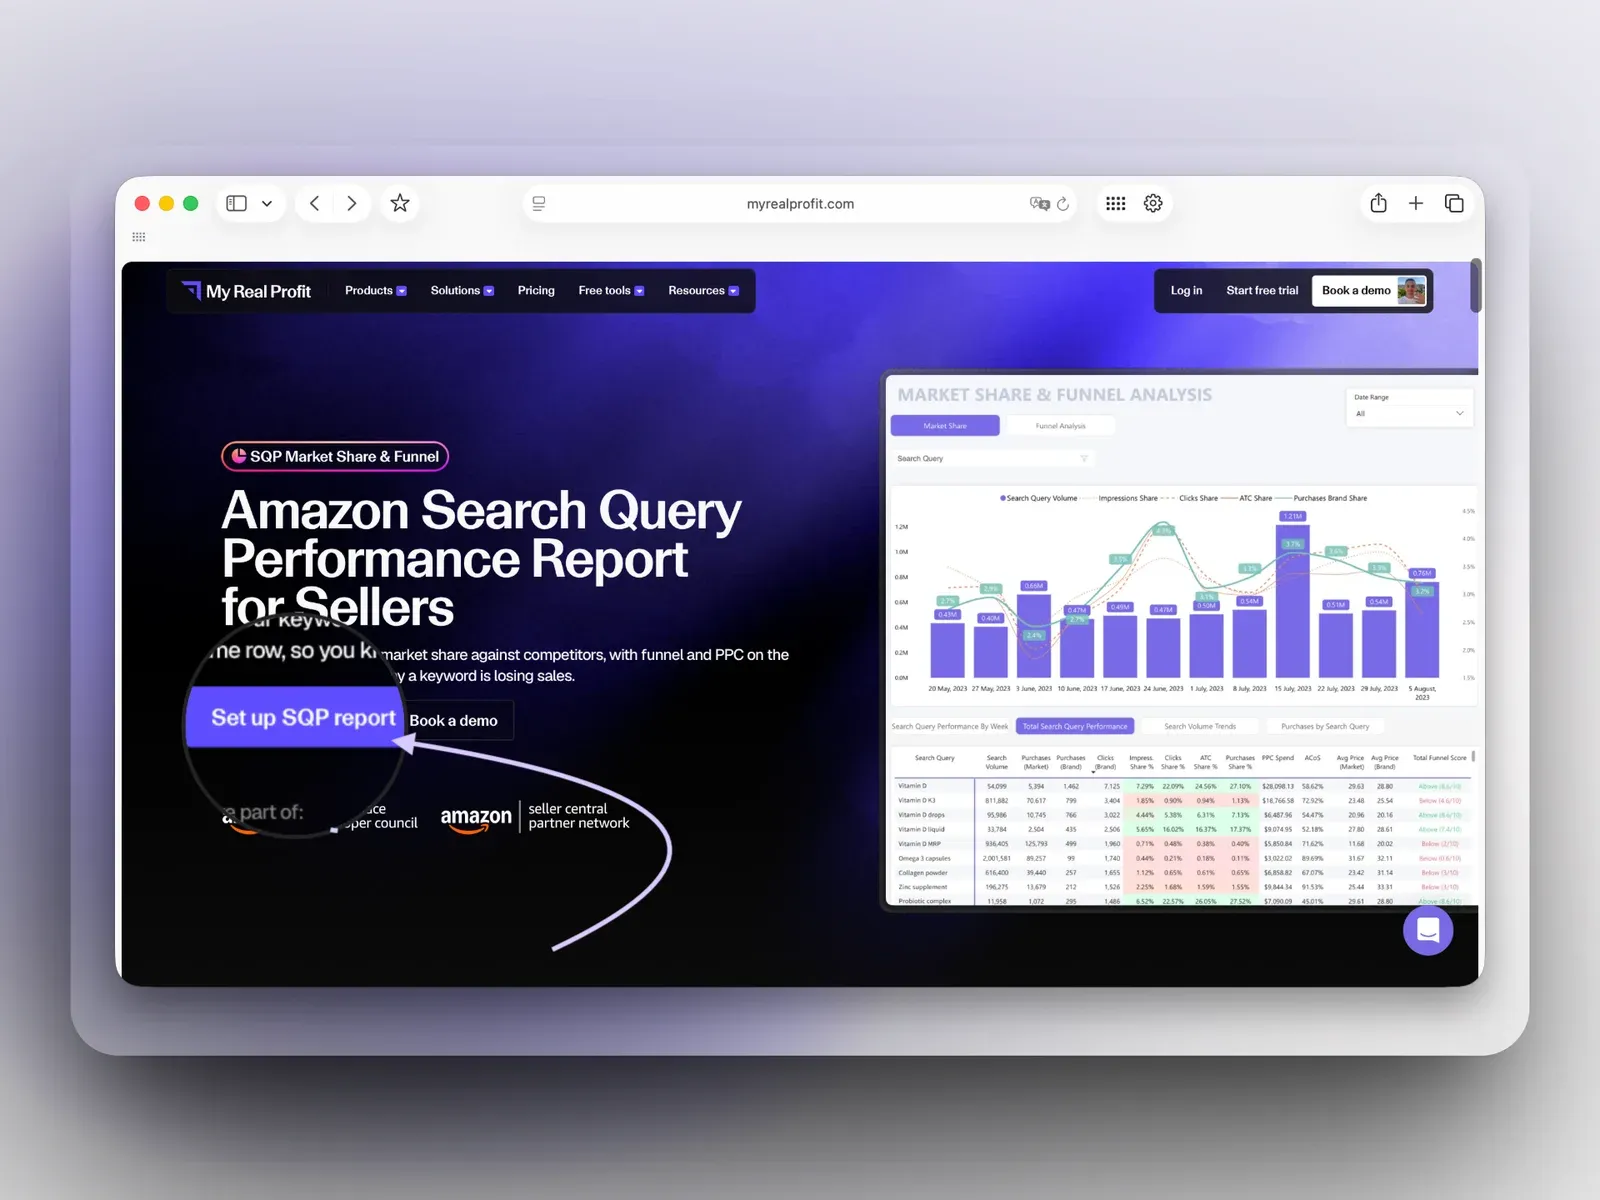
Click the 'Set up SQP report' button at the top of the page. Fill in the form and choose your business type, then click 'Start 21-day free trial'. No credit card is required.
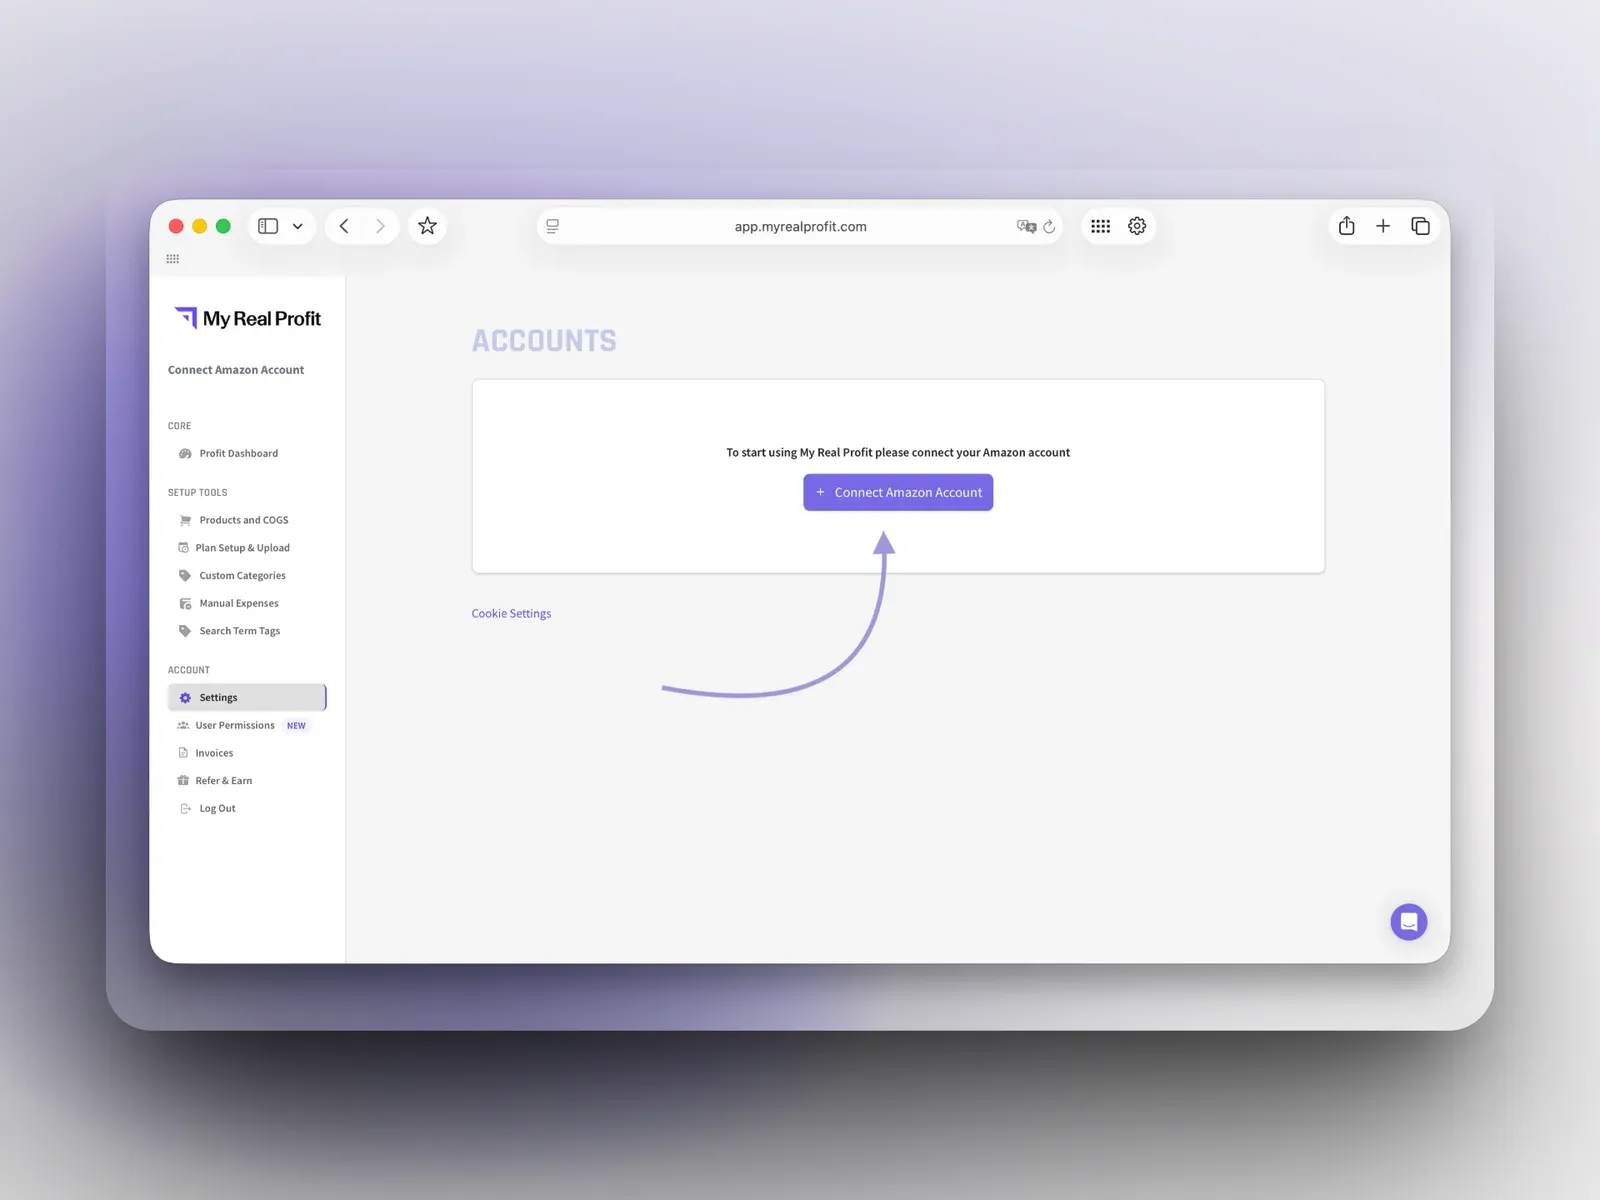
On the Accounts page, click 'Connect Amazon Account' and connect by region (North America, Europe, or Far East). This takes under five minutes.
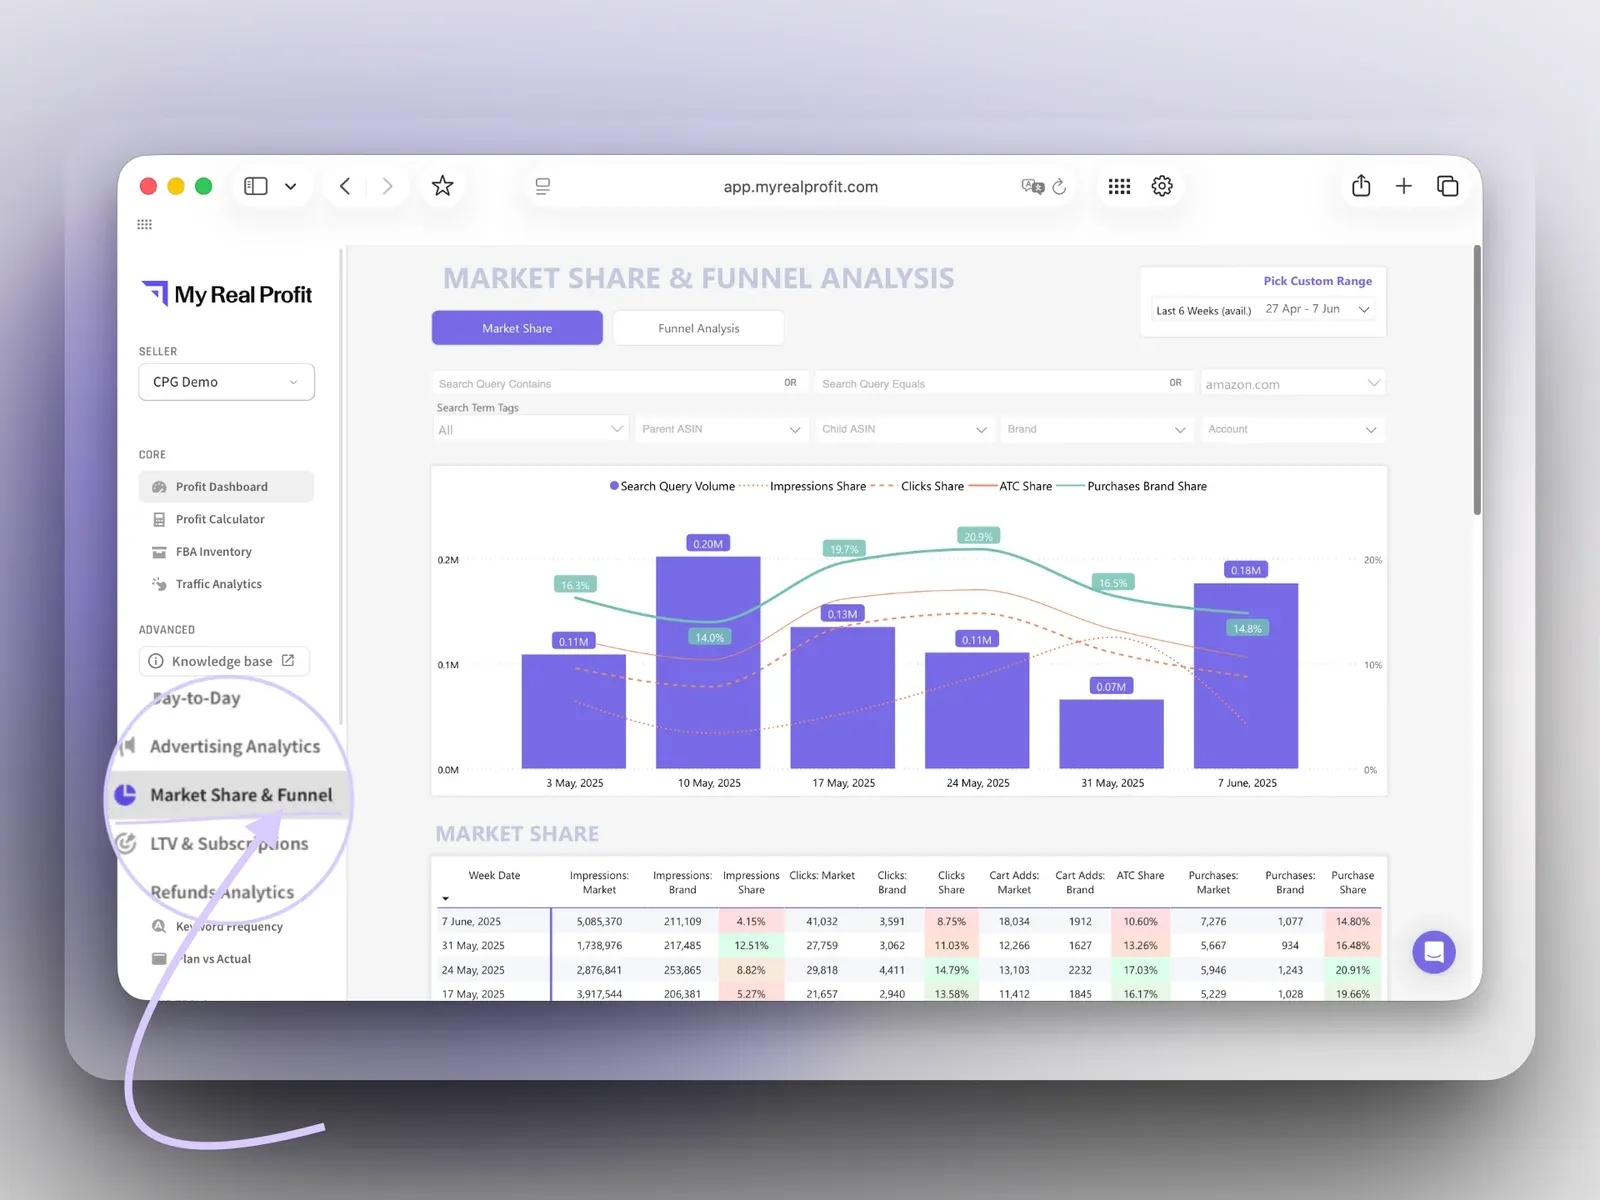
Your data imports automatically and you land on the Profit Dashboard (full reports are ready in 2 to 3 days). In the left menu, under Advanced, click Market Share & Funnel. This is your Search Query Performance report.
See it in the video below. In the walkthrough, you can:
See your real market share by keyword, not just your own sales.
Read share metrics with PPC Spend and ACoS on the same keyword row.
Test a new main image or A+ content using Funnel Score, with branded keywords excluded.
Audit many ASINs and brands fast, and spot cannibalization across a catalog.
A keyword can lose share for many reasons, and raw SQP data won't tell you which. This Search Query Performance report puts your market share, funnel, and PPC in one view, on your real Amazon data. See if a drop is you or the market, find the weak step, and check price before you act. Start with a 21-day free trial, no credit card required.
Book a free demo call or start your free trial today and see
exactly how it works for your business.