











Helium 10 Alternative

Helium 10 Alternative: a full accrual P&L, not a Profits tab

Helium 10 finds and launches products. My Real Profit runs the brand you built with it: customer lifetime value, cohorts, Plan vs Actual, and year-over-year comparisons that the research suite was never built to give you.

Built for CPG brands and agencies.

Test My Real Profit Now
  • Ranked #1 of 30+ Amazon tools, 2023 & 2025
  • 5-star on the Amazon Selling Partner Appstore
  • Trusted by 1,500+ Amazon brands
Best Seller in Deodorants
Salt & Stone

100%

NTB accuracy

3×

Faster Insights

Best Seller in Sea Vegetables
True Sea Moss

2×

Subscriber Growth

40%

NTB increase

Top agency
Trivium

100%

Auto Reporting

50hrs+

Saved

Best Seller in Home & Kitchen
CGK Linens

-18%

Wasted ad spend

10x

Decision Speed

Best Seller in Headbands
Kitsch

5hrs+

Saved Daily

100%

Profit Clarity

Best Seller in Energy Chews
Neuro

3×

Optimization

100%

Branded view

Top agency
TripleLine

100%

Centralized Data

5×

Reporting Speed

Best Seller in Cutting Boards
Royal Craft Wood

+13%

Gross margin

−22%

Refund reduction

Best Seller in Stick Umbrellas
UEP

4×

Efficiency Gain

100%

Cost Control

Head to head

How My Real Profit and Helium 10 compare

Every row is honest. Helium 10 gets a check wherever it earns one, and "partial" where the answer is "sort of".

My Real Profit
Helium 10
Planning
Plan vs Actual (set targets & plan, track actuals)
True profit & P&L
Live P&L, every Amazon fee reconciled Helium 10: Profits is a side module
P&L by product and ASIN Helium 10: Profits tracks profit at SKU level
New-to-Brand/Repeat P&L
Profit calculator per unit Helium 10: listing-level estimates
Market & search
Market share tracking Helium 10: strong, keyword-level
Search Query Performance (SQP) analytics Helium 10: keyword research, not the Amazon SQP report
Brand CTR/CVR vs competitors
Customer & lifetime value
New-to-Brand vs repeat revenue split
Lifetime value & cohort analytics
Subscribe & Save analytics (real vs fake) pending-order accurate
Advertising
Advanced advertising analytics by keyword, placement, search term, campaign, hour Helium 10: Adtomic suite, bid automation
Break-even ACoS (LTV-aware)
Reporting depth
Daily business report (40+ KPIs, customizable) Helium 10: Profits dashboard, fixed set of metrics
Year-over-year & period comparisons
Custom / customizable analytics
AI access through an MCP connector Helium 10: exports and in-app AI assistants, no MCP connector
Operations, agencies & team
Inventory analytics Helium 10: inventory management and restock forecasting
Agency client reporting & multi-user access Helium 10: multi-user logins on Diamond and above, no client reporting
Dedicated human data team
Data freshness
Hourly data refresh
Only in Helium 10
Keyword and product research
Listing optimization and rank tracking
Available
Not available
Partial

See your real numbers on your own account

  • 21-day free trial
  • Full access to every report and metric during the trial
Start your 21-day free trial

Amazon-partner grade data. Cancel anytime.

Only in My Real Profit

Where My Real Profit goes further than Helium 10

Leverage the SQP report to win the competition

Fix keywords where you cannibalize your own organic sales, and read impression, click and purchase share for every search query straight from Amazon SQP data. Each keyword sits next to the PPC spend and ACoS it carries.

Market share & funnel 14.3% share
SQP By Week SQP By Keyword SQP By Parent SQP By Child Compare All SQP
Search Query Search Volume Purchases(Market) Purchases(Brand) Clicks(Brand)▾ Impress.Share % ClicksShare % ATCShare % PurchasesShare % PPC Spend ACoS
multivitamin 48,311 5,156 180 626 4.60% 3.14% 3.18% 3.49% $ 2,561 47.22%
vitamin c 120,532 11,963 174 578 1.31% 1.29% 1.41% 1.45% $ 1,499 38.07%
vitamin c 500mg 9,740 600 106 358 3.63% 13.86% 14.83% 17.67% $ 1,394 26.68%
vitamin c + d 28,956 2,556 119 315 2.62% 2.79% 3.54% 4.66% $ 809 77.26%
immune support 133,280 11,445 101 253 0.58% 0.47% 0.56% 0.88% $ 2,376 40.46%
vitamin d3 1,988 165 73 187 10.14% 24.28% 32.73% 44.24% $ 631 46.36%

See your true customer lifetime profit and loss

The only P&L that splits your numbers by new-to-brand and repeat customers. See the real margin on each customer type.

P&L · New to Brand vs Repeat 44.45% repeat margin
June 2026
New to Brand Repeat Total
Sales $134,650.19 $517,096.04 $651,746.23
Units Sold 4,931 19,183 24,114
-
Cost of Goods Sold $31,609.63 $115,568.98 $147,178.61
Cost of Goods Sold % 23.48% 22.35% 22.58%
-
Gross Profit $103,040.56 $401,527.06 $504,567.62
Gross Profit % 76.52% 77.65% 77.42%
-
Referral Fee $19,938.03 $74,782.58 $94,720.61
FBA Fee $20,159.79 $78,267.27 $98,427.06
Amazon Fees Total $40,097.82 $153,049.85 $193,147.67
Amazon Fees % 29.78% 29.60% 29.64%
-
PPC Advertising Spend $47,324.20 $47,324.20
Promotions / Coupons $1,717.75 $18,604.36 $20,322.11
Coupon Redemption Fees $666.29 $1,314.98 $1,981.27
Deal Fees
Total Marketing $49,041.95 $18,604.36 $67,646.31
Total Marketing % 36.42% 3.60% 10.38%
-
Profit From Sales $8,590.72 $229,872.85 $238,463.57
Profit from Sales Margin 6.38% 44.45% 36.59%

Query every insight with AI, through MCP

Ask questions about your Amazon data in plain language. Every report is available through an MCP connector, so the answers land in the AI tool your team already uses.

My Real Profit MCP AI + MCP ready
Claude · connected to my-real-profit-mcp

my-real-profit-mcp · inbound_placement_fees

Year to date you've been charged $4,127.53 in inbound placement fees. Month by month:

$620
Jan
$541
Feb
$590
Mar
$610
Apr
$680
May
$746
Jun
$340
Jul

Set targets, then track live against them

Set targets for sales, spend, and profit. Watch actuals update in real time so you see the gap before the month ends.

Plan vs Actual on track

Total Sales

$1,399,177

vs Target: $1,438,960 (97.2%)

Units

83,106

vs Target: 66,979 (124.1%)

Marketing Spend

$215,748

vs Target: $0

Profit

$186,728

vs Target: —

Total Sales Units Marketing Spend Profit
Total Sales Target Total Sales Actual
$30K $40K $50K $60K $40.1K $37.4K $52.4K $37.8K $50.3K $41.3K $53.9K $37.8K $47.6K $37.8K $44.3K 01 02 03 04 05 06 07 08 09 10 11 12 13 14 15 16 17 18 19 20 21 22 23 24 25 26 27 28 29 30 31 May 2026

Run the whole business from one daily view

One report with 40+ Amazon KPIs: organic %, NTB orders, TACoS, profit margin, ROI, S&S rate, PPC ACoS, conversion rate. Pick which KPIs you see and read them by day, week or month.

Day-to-day report 40+ KPIs
Day Week Month
May 18–24 May 25–31 Jun 1–7 Jun 8–14 Jun 15–21 Jun 22–28 Total
Total Sales $ 234,348 $ 239,922 $ 224,059 $ 210,854 $ 224,802 $ 216,064 $ 1,350,049
Units Sold 11,663 11,603 10,263 10,109 10,748 10,561 64,947
Orders 5,078 5,007 4,508 4,479 4,719 8,689 32,480
Organic % 76.29% 76.69% 79.20% 82.99% 82.63% 82.40% 79.92%
AVG Price $ 18.97 $ 19.57 $ 20.74 $ 19.73 $ 19.74 $ 19.33 $ 19.66
S&S Orders 1,965 1,901 1,675 1,765 2,074 3,423 12,803
S&S Orders % 38.70% 37.96% 37.16% 39.42% 43.94% 39.39% 39.42%
NTB Orders 1,393 1,343 1,088 984 908 1,992 7,707
NTB Orders % 27.43% 26.82% 24.14% 21.96% 19.23% 22.93% 23.73%
TACoS 18.68% 17.69% 12.55% 11.08% 13.16% 12.34% 14.37%
Total Marketing % 24.48% 23.74% 17.85% 17.12% 19.03% 18.57% 20.24%
Total CPA $ 11.30 $ 11.37 $ 8.87 $ 8.06 $ 9.06 $ 4.62 $ 8.41
Profit From Sales $ 45,374 $ 52,457 $ 65,795 $ 59,492 $ 59,877 $ 56,962 $ 339,957
Profit Margin 19.36% 21.86% 29.37% 28.21% 26.64% 26.36% 25.18%
Profit per Unit $ 3.89 $ 4.52 $ 6.41 $ 5.89 $ 5.57 $ 5.39 $ 5.23
ROI 79.60% 93.36% 131.73% 119.92% 114.35% 111.00% 107.43%
Pending Orders % 0.01% 0.01% 0.00%
-
PPC Sales $ 57,721 $ 58,039 $ 48,598 $ 37,558 $ 41,853 $ 40,344 $ 284,114
PPC Spend $ 43,783 $ 42,454 $ 28,126 $ 23,365 $ 29,583 $ 26,654 $ 193,965
PPC CPC $ 4.03 $ 3.98 $ 3.54 $ 3.62 $ 4.07 $ 3.75 $ 3.86
PPC CTR 0.22% 0.23% 0.35% 0.18% 0.30% 0.21% 0.24%
PPC ACoS 75.85% 73.15% 57.87% 62.21% 70.68% 66.07% 68.27%
PPC CPA $ 18.34 $ 17.73 $ 14.47 $ 15.56 $ 17.97 $ 16.41 $ 16.87
PPC Conversion % 21.96% 22.47% 24.50% 23.24% 22.63% 22.84% 22.85%
Discounts $ 13,141 $ 12,848 $ 11,271 $ 11,528 $ 12,744 $ 11,960 $ 73,492
-
Total Sessions 20,735 20,492 16,385 16,338 15,732 18,285 107,967
Conversion Rate % 24.49% 24.43% 27.51% 27.41% 30.00% 47.52% 30.08%

Track every cohort’s profit over time

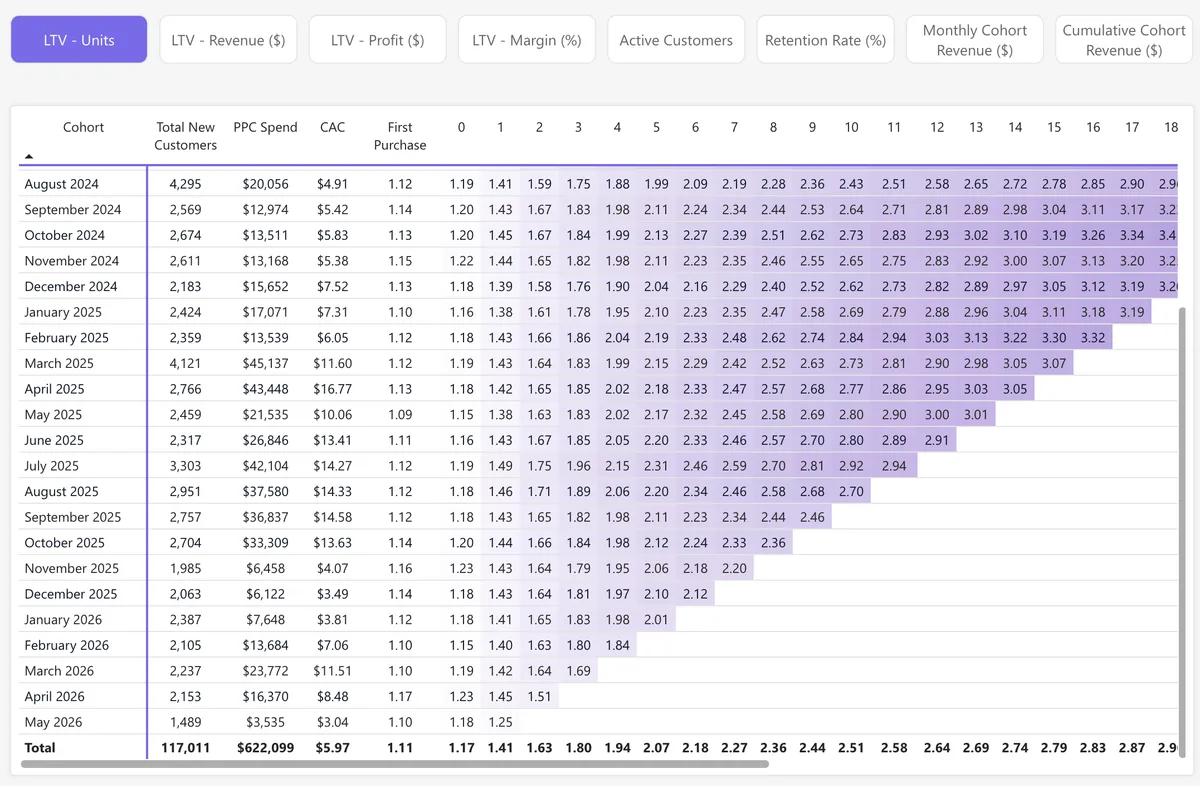
See which cohorts of customers pay back and how fast. Breakdowns by retention, units, profit, revenue and margin.

LTV by monthly cohort last 12 months
LTV - Units LTV - Revenue ($) LTV - Profit ($) LTV - Margin (%)
Cohort New Customers CAC 0123456789101112
July 2025 17,357 $15.97 1.16 1.27 1.40 1.52 1.62 1.71 1.79 1.86 1.93 2.00 2.06 2.12 2.13
August 2025 19,634 $17.19 1.14 1.25 1.39 1.51 1.61 1.70 1.79 1.87 1.94 2.02 2.09 2.10
September 2025 22,195 $18.30 1.14 1.25 1.38 1.49 1.59 1.67 1.77 1.84 1.92 1.99 2.00
October 2025 17,431 $16.38 1.17 1.27 1.40 1.53 1.62 1.71 1.80 1.88 1.96 1.97
November 2025 14,693 $15.62 1.14 1.24 1.37 1.48 1.59 1.68 1.77 1.86 1.87
December 2025 18,516 $16.62 1.11 1.21 1.34 1.47 1.57 1.67 1.78 1.79
January 2026 20,519 $13.94 1.10 1.20 1.33 1.46 1.56 1.66 1.68
February 2026 16,100 $13.95 1.09 1.20 1.34 1.46 1.58 1.59
March 2026 19,234 $14.18 1.10 1.20 1.34 1.48 1.49
April 2026 17,813 $15.06 1.10 1.20 1.36 1.38
May 2026 19,750 $15.11 1.11 1.22 1.25
June 2026 16,362 $14.49 1.14 1.15
Total 747,731 $10.82 1.14 1.27 1.43 1.56 1.68 1.78 1.88 1.97 2.05 2.12 2.19 2.25 2.31

See a live P&L with every Amazon fee reconciled

Every referral, FBA, storage, promotion and coupon fee lands in one accrual P&L, down to product and ASIN. Pending orders are included, so the margin you read today still holds next week.

Profit & Loss · accrual every fee reconciled
P&L lineJan 2026Feb 2026Mar 2026Apr 2026May 2026Jun 2026
Sales$1,254,267$952,789$878,926$927,998$1,552,262$1,560,734
Cost of Goods Sold$231,28018.44%$159,50616.74%$149,78217.04%$156,13216.82%$260,37816.77%$258,20616.54%
Amazon Fees Total$505,91340.34%$352,17636.96%$326,03437.09%$329,51435.51%$549,29935.39%$547,94735.11%
Refunds Costs$39,6373.16%$24,1352.53%$24,2502.76%$25,7302.77%$37,1682.39%$35,1732.25%
Marketing$192,58515.35%$170,43317.89%$132,85315.12%$79,9578.62%$186,48512.01%$217,29413.92%
Other / Adj. expenses$33,8732.70%$28,2012.96%$18,8202.14%$17,9291.93%$11,2070.72%$9,6340.62%
Profit$250,97920.01%$218,33822.92%$227,18725.85%$318,73634.35%$507,72532.71%$492,48031.55%

See where your listing wins clicks and where it loses them

Compare your CTR and CVR against competitors at the keyword level. See which keywords your listing wins and which ones it loses.

Brand vs market · CTR and CVR keyword level
All SQPBrand vs MarketBy ParentCompare
Search QueryCTR (Brand)CTR (Market)CVR (Brand)CVR (Market)Funnel score
b complex energy support tablets0.97%1.79%9.4%12.6%Below (3.2 / 10)
vitamin d3 supplement for immune support2.45%1.82%14.1%11.7%Above (7.6 / 10)
iron supplement gentle on stomach0.50%1.56%8.8%13.0%Below (2.9 / 10)
multivitamin for women3.14%2.41%15.2%12.9%Above (8.1 / 10)
immune support gummies1.28%1.33%11.9%12.2%Even (5.2 / 10)

Know which S&S subscribers will actually stay

See which subscribers stay and which ones sign up just for the discount. Your real S&S retention rate is calculated on pending orders too, so the number holds up.

S&S · Real vs fake 93.06% discount-only
All Sales | NTB / RepeatS&S vs RegularS&S | Real vs Fake
All S&S sales Real S&S sales Fake S&S % of all S&S
$10K $20K $30K 0% 50% 100% 93.06% 02/1503/0803/2904/1905/1005/31

See which placement earns profit and which hour wastes budget

Read ad performance by placement, search term, campaign and hour. Every cut shows profit after fees, so you find where to cut spend before it compounds.

Advertising analytics by placement & hour
SalesCampaignsPlacements InsightsIntraday
PlacementImpressionsClicksSalesSpendAd profitNet ACoS
Sponsored Products5,904,93815,197$91,676$51,608-$8,76559.09%
Top of search2,318,2047,412$49,730$29,884-$6,14063.44%
Rest of search2,104,5514,988$25,109$13,662$1,14852.18%
Product pages1,482,1832,797$16,837$8,062$1,22745.60%
Sponsored Brands1,204,6103,118$18,942$9,470$41248.29%
Sponsored Display842,0041,905$8,571$5,610-$1,20469.13%

Set your ACoS target on lifetime value, not the first sale

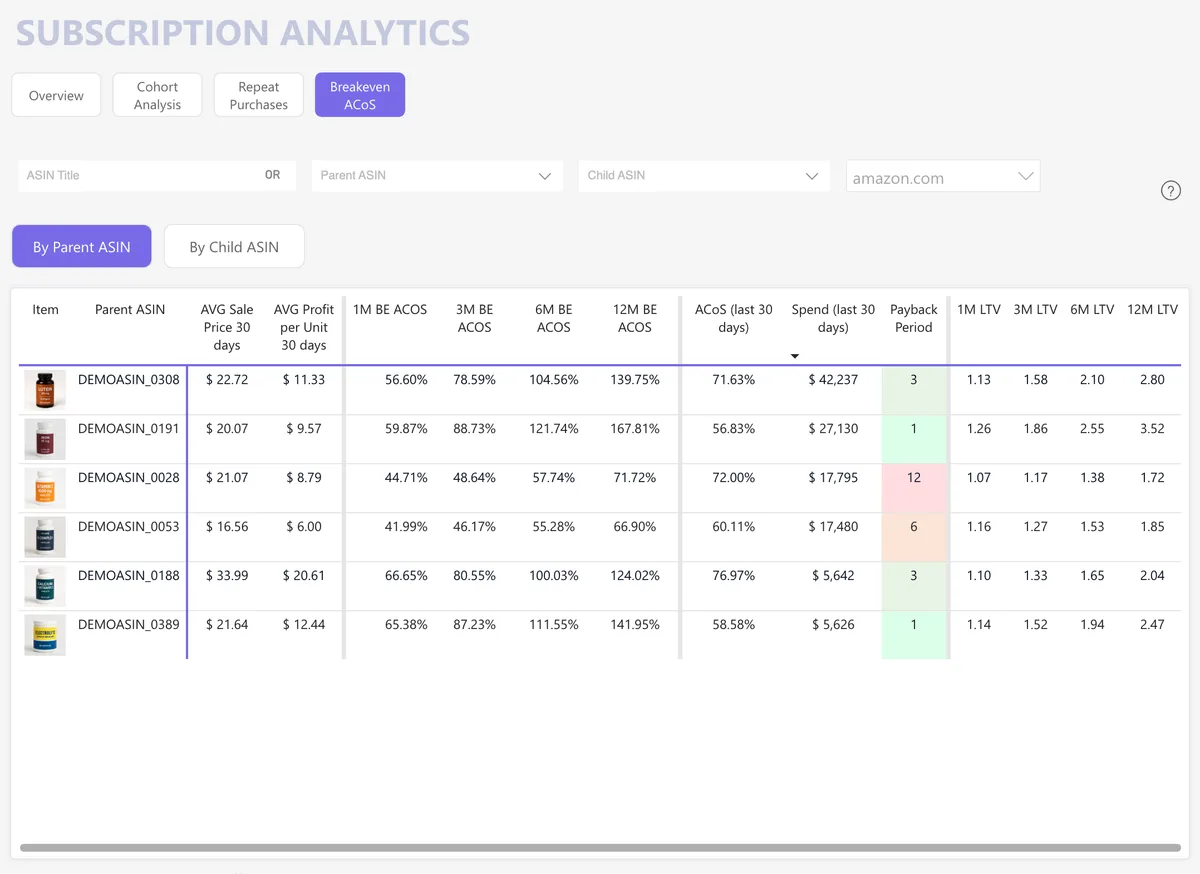
Calculate break-even ACoS using lifetime value, not just first-order profit. Bid more on high-LTV products without losing money.

Advertising · campaign profit LTV-aware
CampaignsKeywords & search terms Break-even ACoS (LTV-aware): 61.4%
CampaignSpendSalesAd profitAmz ACoSNet ACoS
All campaigns$ 36,712$ 75,099-$ 2,09448.88%51.32%
SP - Exact - Main Keywords - TOS$ 14,206$ 22,940-$ 2,41761.93%64.85%
SP - Exact - Brand Defense$ 2,914$ 18,760$ 3,18015.53%16.42%
SP - Broad - Discovery$ 6,481$ 9,742-$ 1,33866.53%69.71%
SP - Auto - Close Match$ 3,769$ 7,455-$ 20450.56%53.11%
SP - PT - Competitor ASINs$ 4,102$ 6,318-$ 90364.93%68.24%
SB - Exact - Category Terms - TOS$ 5,240$ 9,884-$ 41253.01%55.87%

Net ACoS is shaded against your break-even, so a campaign that looks expensive on first-order ACoS can still be profitable once lifetime value is counted.

Keep stock decisions inside the profit view

Track cover, restock timing and stranded units next to the margin each product earns. Every stock call is read against profit, not units alone.

FBA inventory stock + margin
ProductSellableReservedPending inboundInventory valueUnits sold 30 dCover
Demo Product 0221 SKU: DEMOSKU_022129,2575,8200$177K19,61145 d
Demo Product 0152 SKU: DEMOSKU_015232,3309,63760$249K15,10064 d
Demo Product 0291 SKU: DEMOSKU_029150,31513,703133$471K14,990101 d
Demo Product 0458 SKU: DEMOSKU_045834,6445,58297$183K13,07179 d
Demo Product 0352 SKU: DEMOSKU_035211,5472,25520$67K11,81229 d
Demo Product 0406 SKU: DEMOSKU_040610,4891,6270$71K4,61068 d

Manage all client accounts and share reports from one place

Switch between client accounts, share reports, and set access rights for each team member from one workspace. Client reporting is built in, not a seat count.

Agency · client accounts multi-account
Client accountsUser permissions + Add user
ClientShared sellersUsers
Northwood SupplementsAmazon US, Amazon CA4
Kestrel HomeAmazon US2
Bright Harbor PetAmazon US, Amazon UK, Amazon DE6
Lumen SkincareAmazon UK1

A dedicated data team monitors your numbers for you

A human team checks your data and fixes issues. If something looks wrong, a real person investigates.

Data health · weekly review human reviewed
Weekly data review 2 issues fixed Reviewed by your analyst · 3 days ago
  • 100%COGS coverage1,284 of 1,284 active ASINs costed
  • MatchedFee reconciliationSettlement vs orders, last 30 days
  • FixedMissing inbound placement feesFound on 3 shipments, re-pulled and backfilled
  • FixedSubscribe & Save pending ordersDuplicate rows removed before margin ran
  • HealthyAdvertising API syncHourly, no gaps in the last 14 days

Compare any period against the same period last year

Put any date range next to last year or against the period before it. Build custom reports on your own metrics when the standard cuts are not enough.

P&L · Compare periods year over year
OverviewDetailedCompare PeriodsPeriodThis month vs same month last year
NameCurrent periodPrevious periodDifference% change
Sales$950,609$1,001,736-$51,126-5.10%
COGS$220,355$234,365-$14,010-5.98%
FBA & referral fees$279,029$295,577-$16,548-5.60%
Storage fee$2,596$2,118$47822.57%
PPC cost$117,606$171,468-$53,861-31.41%
Profit$257,272$194,547$62,72532.24%
Profit margin27.06%19.42%7.64%39.35%

Switching is painless

You almost certainly should not drop Helium 10 if you still research and launch. This is additive: keep Helium 10 for what it is great at, and add My Real Profit for the profit and customer analytics it was never designed to carry.

Setup is two clicks and fully automated, with no contracts, no credit card, and a 21-day free trial for any company size. Run both and see where your real decisions get made.

FAQ

Questions brands ask before choosing between My Real Profit and Helium 10

Usually not, and it does not try to. Helium 10 is a research suite, My Real Profit is a profit-analytics platform. Most brands keep Helium 10 for keyword research and launches and add My Real Profit for the operating analytics, lifetime value, and customer economics.
It is enough for a daily profit glance. It does not split your P&L by new-to-brand and repeat customers, track cohorts, or let you set targets and watch actuals against them. Those are the questions a growing brand runs on.
Yes. The overlap is a profit snapshot and keyword data. You keep Helium 10 for research, listing work and rank tracking, and use My Real Profit for the P&L, customer economics and reporting. Run both through the trial and see which one your team opens.
No. My Real Profit is analytics only. We show ad performance by placement, search term, campaign and hour, with profit after fees on every cut, but we do not change bids. Keep Adtomic for automation and use My Real Profit to check whether that automation actually earns money.
From your own Amazon order history through the API. We match repeat purchases to build cohorts, so LTV is rebuilt from real orders, not estimated from a sample.

See your real numbers before you decide

  • 21-day free trial
  • Full access to every report and metric during the trial
Start your 21-day free trial

Amazon-partner grade data. Cancel anytime.

Last updated September 2026. Helium 10 details are based on their public pricing and documentation at that date. Check their site for the latest.