











My Real Profit vs HelloProfit

What does My Real Profit do that HelloProfit can’t?

Explore the features, data and dashboards that make top Amazon sellers choose My Real Profit over HelloProfit.

Built for CPG brands and agencies.

Start your 21-day free trial

Limited time deal 50% off your first month after the trial

  • Ranked #1 of 30+ Amazon tools, 2023 & 2025
  • 5-star on the Amazon Selling Partner Appstore
  • Trusted by 1,500+ Amazon brands
Best Seller in Deodorants
Salt & Stone

100%

NTB accuracy

Faster Insights

Best Seller in Sea Vegetables
True Sea Moss

Subscriber Growth

40%

NTB increase

Top agency
Trivium

100%

Auto Reporting

50hrs+

Saved

Best Seller in Home & Kitchen
CGK Linens

-18%

Wasted ad spend

10x

Decision Speed

Best Seller in Headbands
Kitsch

5hrs+

Saved Daily

100%

Profit Clarity

Best Seller in Energy Chews
Neuro

Optimization

100%

Branded view

Top agency
TripleLine

100%

Centralized Data

Reporting Speed

Best Seller in Cutting Boards
Royal Craft Wood

+13%

Gross margin

−22%

Refund reduction

Best Seller in Stick Umbrellas
UEP

Efficiency Gain

100%

Cost Control

Positioning

Not better. Further.

HelloProfit and My Real Profit sit on the same axis, a generation apart. HelloProfit built the merchant profit dashboard sellers grew up on. My Real Profit is where you keep going when the questions outgrow the dashboard: customers, cohorts, market share, and what acquisition is worth.

Profit dashboards

Covered by both tools.

  • Merchant-level profit view
  • P&L by product and ASIN
  • PPC performance tracking
  • Payout reconciliation
Where dashboards stop answering

Full CPG analytics

Only in My Real Profit.

  • Market share & SQP
  • Live KPI tracking
  • Cohort analytics
  • Subscribe & Save
  • Plan vs Actual tracking
  • Brand vs competitor benchmarks
  • Custom reports

HelloProfit is a solid profit dashboard from the first generation of seller tools; My Real Profit is an analytics platform built for the customer-economics questions brands ask now.

Start free, 21 days, no card

Limited time deal 50% off your first month after the trial

Keep both through your trial and see which one you open.

Head to head

How My Real Profit and HelloProfit compare

Every row is honest. HelloProfit gets a check wherever it earns one, and "partial" where the answer is "sort of".

My Real Profit
HelloProfit
Planning
Plan vs Actual (set targets & plan, track actuals)
True profit & P&L
Live P&L, every Amazon fee reconciled HelloProfit: payout-led reporting
P&L by product and ASIN
New-to-Brand/Repeat P&L
Profit calculator per unit
Merchant and product profit dashboards
Market & search
Market share tracking
Search Query Performance (SQP) analytics
Brand CTR/CVR vs competitors
Customer & lifetime value
New-to-Brand vs repeat revenue split
Lifetime value & cohort analytics
Subscribe & Save analytics (real vs fake) pending-order accurate
Customer order history HelloProfit: basic customer stats
Advertising
Advanced advertising analytics by keyword, placement, search term, campaign, hour HelloProfit: campaign manager
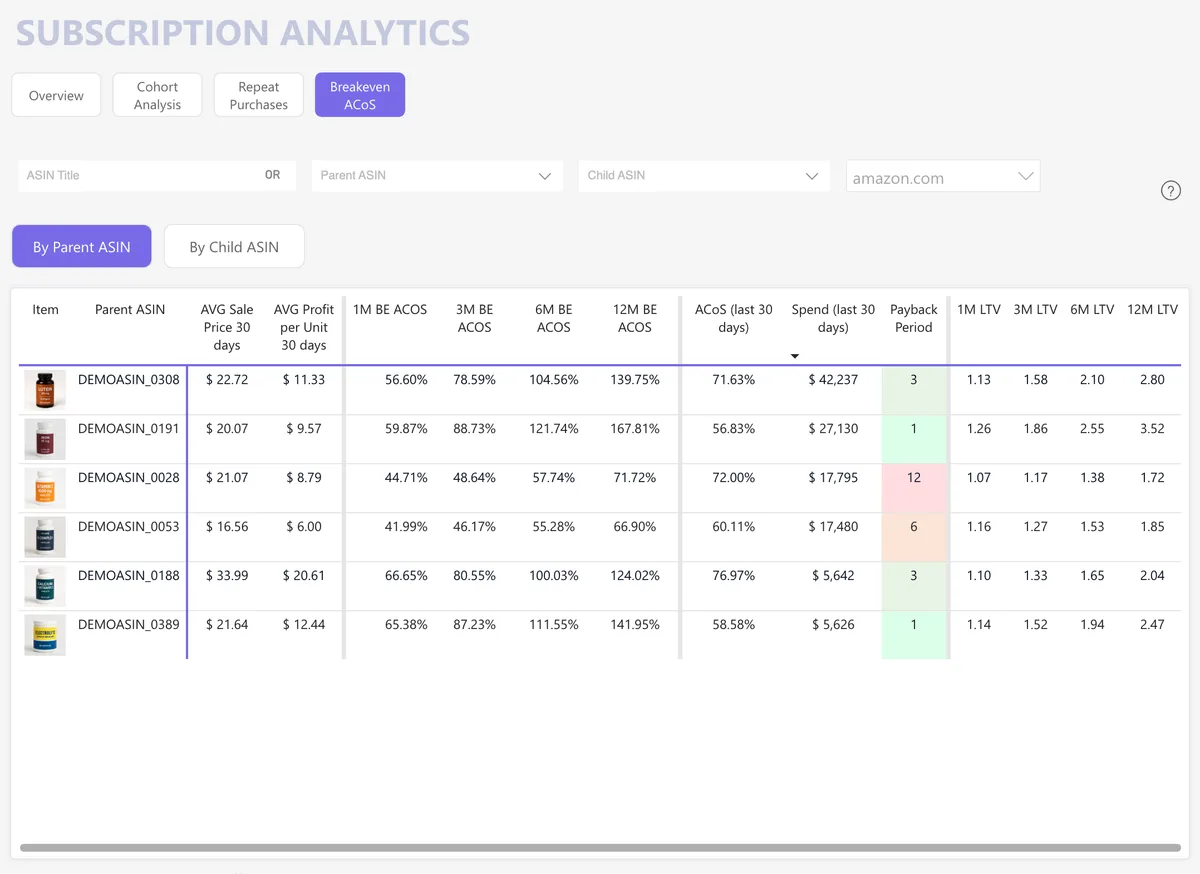
Break-even ACoS (LTV-aware)
Reporting depth
Daily business report (40+ KPIs, customizable)
Year-over-year & period comparisons
Custom / customizable analytics
Operations, agencies & team
Inventory analytics
Agency client reporting & multi-user access
Dedicated human data team
Available
Not available
Partial
Limited time deal

See your real numbers on your own account

  • 21-day free trial
  • Full access to every report and metric during the trial
  • Then 50% off your first month
Claim my offer and start my trial

Amazon-partner grade data. Cancel anytime.

Only in My Real Profit

7 things only My Real Profit can do

Leverage the SQP report to win the competition

Fix keywords where you cannibalize organic sales, identify opportunity keywords, and track market share on keywords where you dominate the market.

Market share & funnel 14.3% share
SQP By Week SQP By Keyword SQP By Parent SQP By Child Compare All SQP
Search Query Search Volume Purchases(Market) Purchases(Brand) Clicks(Brand) Impress.Share % ClicksShare % ATCShare % PurchasesShare % PPC Spend ACoS
multivitamin 48,311 5,156 180 626 4.60% 3.14% 3.18% 3.49% $ 2,561 47.22%
vitamin c 120,532 11,963 174 578 1.31% 1.29% 1.41% 1.45% $ 1,499 38.07%
vitamin c 500mg 9,740 600 106 358 3.63% 13.86% 14.83% 17.67% $ 1,394 26.68%
vitamin c + d 28,956 2,556 119 315 2.62% 2.79% 3.54% 4.66% $ 809 77.26%
immune support 133,280 11,445 101 253 0.58% 0.47% 0.56% 0.88% $ 2,376 40.46%
vitamin d3 1,988 165 73 187 10.14% 24.28% 32.73% 44.24% $ 631 46.36%

See your true customer lifetime profit and loss

The first and only P&L report with a breakdown of your financials by new-to-brand and repeat customers. See what a customer is really worth.

P&L · New to Brand vs Repeat 44.45% repeat margin
June 2026
New to Brand Repeat Total
Sales $134,650.19 $517,096.04 $651,746.23
Units Sold 4,931 19,183 24,114
-
Cost of Goods Sold $31,609.63 $115,568.98 $147,178.61
Cost of Goods Sold % 23.48% 22.35% 22.58%
-
Gross Profit $103,040.56 $401,527.06 $504,567.62
Gross Profit % 76.52% 77.65% 77.42%
-
Referral Fee $19,938.03 $74,782.58 $94,720.61
FBA Fee $20,159.79 $78,267.27 $98,427.06
Amazon Fees Total $40,097.82 $153,049.85 $193,147.67
Amazon Fees % 29.78% 29.60% 29.64%
-
PPC Advertising Spend $47,324.20 $47,324.20
Promotions / Coupons $1,717.75 $18,604.36 $20,322.11
Coupon Redemption Fees $666.29 $1,314.98 $1,981.27
Deal Fees
Total Marketing $49,041.95 $18,604.36 $67,646.31
Total Marketing % 36.42% 3.60% 10.38%
-
Profit From Sales $8,590.72 $229,872.85 $238,463.57
Profit from Sales Margin 6.38% 44.45% 36.59%

Query every insight with AI, through MCP

Every My Real Profit report is exposed through an MCP connector, so you can ask questions, find insights in plain language, and pull the answers straight into your AI.

My Real Profit MCP AI + MCP ready
Claude · connected to my-real-profit-mcp

my-real-profit-mcp · inbound_placement_fees

Year to date you've been charged $4,127.53 in inbound placement fees. Month by month:

$620
Jan
$541
Feb
$590
Mar
$610
Apr
$680
May
$746
Jun
$340
Jul

Set targets, then track live against them

Plan your sales, spend and profit, then watch actuals against plan, so you see the gap while there's still time to act on it.

Plan vs Actual on track

Total Sales

$1,399,177

vs Target: $1,438,960 (97.2%)

Units

83,106

vs Target: 66,979 (124.1%)

Marketing Spend

$215,748

vs Target: $0

Profit

$186,728

vs Target: —

Total Sales Units Marketing Spend Profit
Total Sales Target Total Sales Actual
$30K $40K $50K $60K $40.1K $37.4K $52.4K $37.8K $50.3K $41.3K $53.9K $37.8K $47.6K $37.8K $44.3K 01 02 03 04 05 06 07 08 09 10 11 12 13 14 15 16 17 18 19 20 21 22 23 24 25 26 27 28 29 30 31 May 2026

Run the whole business from one daily view

Every KPI that runs your brand in one daily report, fully customizable to how your team works.

Day-to-day report 40+ KPIs
Day Week Month
May 18–24 May 25–31 Jun 1–7 Jun 8–14 Jun 15–21 Jun 22–28 Total
Total Sales $ 234,348 $ 239,922 $ 224,059 $ 210,854 $ 224,802 $ 216,064 $ 1,350,049
Units Sold 11,663 11,603 10,263 10,109 10,748 10,561 64,947
Orders 5,078 5,007 4,508 4,479 4,719 8,689 32,480
Organic % 76.29% 76.69% 79.20% 82.99% 82.63% 82.40% 79.92%
AVG Price $ 18.97 $ 19.57 $ 20.74 $ 19.73 $ 19.74 $ 19.33 $ 19.66
S&S Orders 1,965 1,901 1,675 1,765 2,074 3,423 12,803
S&S Orders % 38.70% 37.96% 37.16% 39.42% 43.94% 39.39% 39.42%
NTB Orders 1,393 1,343 1,088 984 908 1,992 7,707
NTB Orders % 27.43% 26.82% 24.14% 21.96% 19.23% 22.93% 23.73%
TACoS 18.68% 17.69% 12.55% 11.08% 13.16% 12.34% 14.37%
Total Marketing % 24.48% 23.74% 17.85% 17.12% 19.03% 18.57% 20.24%
Total CPA $ 11.30 $ 11.37 $ 8.87 $ 8.06 $ 9.06 $ 4.62 $ 8.41
Profit From Sales $ 45,374 $ 52,457 $ 65,795 $ 59,492 $ 59,877 $ 56,962 $ 339,957
Profit Margin 19.36% 21.86% 29.37% 28.21% 26.64% 26.36% 25.18%
Profit per Unit $ 3.89 $ 4.52 $ 6.41 $ 5.89 $ 5.57 $ 5.39 $ 5.23
ROI 79.60% 93.36% 131.73% 119.92% 114.35% 111.00% 107.43%
Pending Orders % 0.01% 0.01% 0.00%
-
PPC Sales $ 57,721 $ 58,039 $ 48,598 $ 37,558 $ 41,853 $ 40,344 $ 284,114
PPC Spend $ 43,783 $ 42,454 $ 28,126 $ 23,365 $ 29,583 $ 26,654 $ 193,965
PPC CPC $ 4.03 $ 3.98 $ 3.54 $ 3.62 $ 4.07 $ 3.75 $ 3.86
PPC CTR 0.22% 0.23% 0.35% 0.18% 0.30% 0.21% 0.24%
PPC ACoS 75.85% 73.15% 57.87% 62.21% 70.68% 66.07% 68.27%
PPC CPA $ 18.34 $ 17.73 $ 14.47 $ 15.56 $ 17.97 $ 16.41 $ 16.87
PPC Conversion % 21.96% 22.47% 24.50% 23.24% 22.63% 22.84% 22.85%
Discounts $ 13,141 $ 12,848 $ 11,271 $ 11,528 $ 12,744 $ 11,960 $ 73,492
-
Total Sessions 20,735 20,492 16,385 16,338 15,732 18,285 107,967
Conversion Rate % 24.49% 24.43% 27.51% 27.41% 30.00% 47.52% 30.08%

Track every cohort’s profit over time

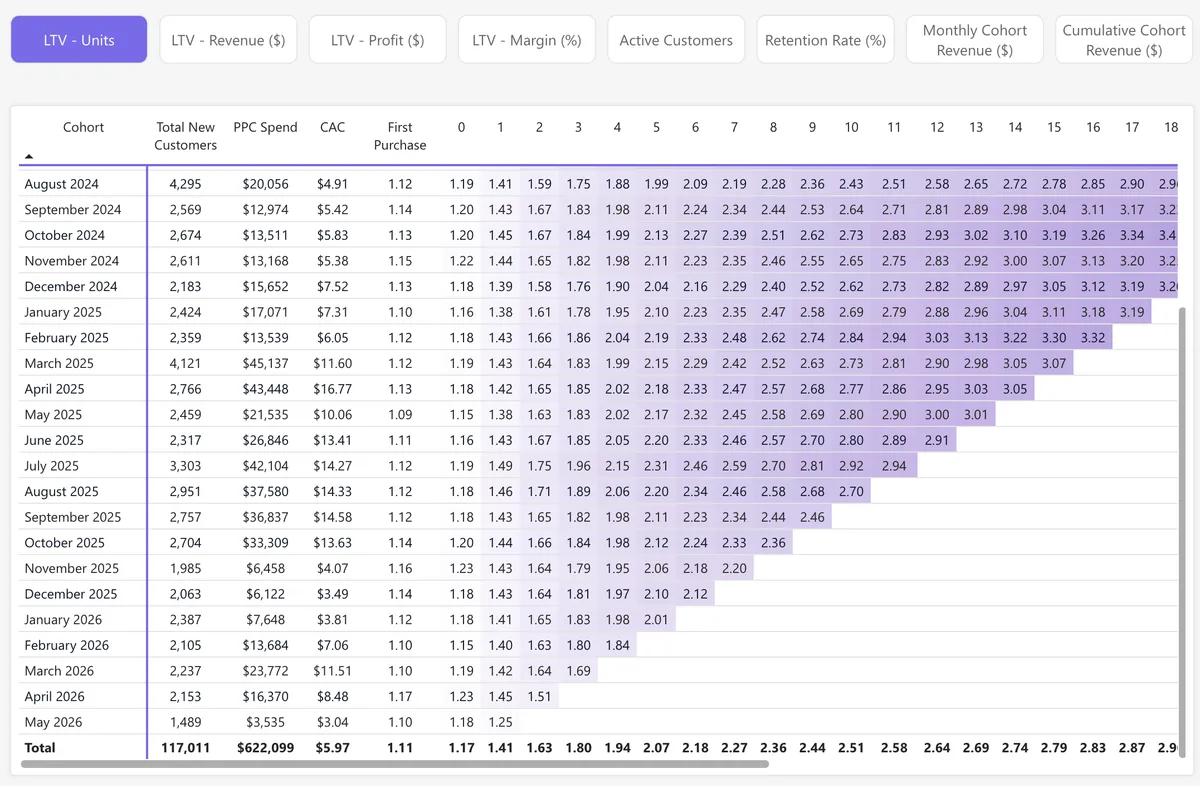
Cohort analytics with breakdowns by retention, units, profit, revenue, active customers, and more. See which cohorts of customers actually pay back, and how fast.

LTV by monthly cohort last 12 months
LTV - Units LTV - Revenue ($) LTV - Profit ($) LTV - Margin (%)
Cohort New Customers CAC 0123456789101112
July 2025 17,357 $15.97 1.16 1.27 1.40 1.52 1.62 1.71 1.79 1.86 1.93 2.00 2.06 2.12 2.13
August 2025 19,634 $17.19 1.14 1.25 1.39 1.51 1.61 1.70 1.79 1.87 1.94 2.02 2.09 2.10
September 2025 22,195 $18.30 1.14 1.25 1.38 1.49 1.59 1.67 1.77 1.84 1.92 1.99 2.00
October 2025 17,431 $16.38 1.17 1.27 1.40 1.53 1.62 1.71 1.80 1.88 1.96 1.97
November 2025 14,693 $15.62 1.14 1.24 1.37 1.48 1.59 1.68 1.77 1.86 1.87
December 2025 18,516 $16.62 1.11 1.21 1.34 1.47 1.57 1.67 1.78 1.79
January 2026 20,519 $13.94 1.10 1.20 1.33 1.46 1.56 1.66 1.68
February 2026 16,100 $13.95 1.09 1.20 1.34 1.46 1.58 1.59
March 2026 19,234 $14.18 1.10 1.20 1.34 1.48 1.49
April 2026 17,813 $15.06 1.10 1.20 1.36 1.38
May 2026 19,750 $15.11 1.11 1.22 1.25
June 2026 16,362 $14.49 1.14 1.15
Total 747,731 $10.82 1.14 1.27 1.43 1.56 1.68 1.78 1.88 1.97 2.05 2.12 2.19 2.25 2.31

Guides and SOPs on how to use it

30+ knowledge-base guides on how to turn your data into profit, from keyword cannibalization to using SQP for product research, written by the founder team that reads these numbers all day.

Knowledge base 30+ guides

Market Share & Funnel

  • Video + guide Report Overview. All metrics explained (Market Share & Funnel)
  • Why Market Share & Funnel Is the Best Report for Organic Ranking
  • How to Do a Weekly Search Query Performance (SQP) Analysis
  • How to Identify Keywords Cannibalizing Your Organic Sales
  • How to Find High-Relevance Keywords You’re Under-Investing In
  • How to Optimize Your Branded Ad Spend
  • How to use SQP for CTR/CVR optimization
  • How to A/B Test a Listing Change Using Funnel Score
  • How to Identify Keywords Fully Supported by PPC and Fix Them
  • How to Use Market Share Data to Identify Product Launch Opportunities

LTV & Subscriptions

  • Video + guide Report Overview. All metrics explained (LTV & Subscription)
  • What Is Cohort Analysis and How It Works
  • How to A/B Test Price and S&S Coupon Using Cohorts
  • How to Audit Your New-to-Brand Acquisition Growth
  • Break-Even LTV ACOS. How to Define the Right ACOS Target.
  • ‘Fake’ Subscribers Guide. What % is OK and what to do about it
  • How to Define Your Repeat-Purchase Retargeting Window

Day-to-day

  • Video + guide Report Overview. All metrics explained (Day-to-day)

Advertising Analytics

  • Video + guide Report Overview. All metrics explained (Advertising Analytics)
  • How to Find and Negate Search Terms with Zero Sales
  • How to Find and Fix High-ACoS Search Terms That Convert
  • Halo Sales. How to Check Whether You’re Advertising the Right ASIN
  • How to Find Keywords Missing from the Right Match Type
  • How to Break Search Terms Into Words and Identify Wasted Ad Spend
  • How to Perform a Placement Performance Audit
  • How to Use Attribution Data to Decide If Retargeting Makes Sense
  • Campaign Budget Analysis: Identify Campaigns Running Out of Budget Mid-Day

Profit & Loss

  • Video + guide Report Overview. All metrics explained (Profit & Loss)

Plan vs Actual

  • How to fill out the report with targets

Switching is painless

Nothing to rip out: connect Seller Central and My Real Profit rebuilds your P&L automatically, then adds the layers a dashboard generation never had. Your history stays in HelloProfit as long as you keep it.

Setup is two clicks and fully automated, with no contracts, no credit card, and a 21-day free trial for any company size. Run both through the trial and keep the one you open.

FAQ

Questions brands ask before choosing between My Real Profit and HelloProfit

Yes, the most direct kind: the same profit-first idea, a generation later. You keep the merchant and product profit views and gain an accrual P&L, new-to-brand vs repeat economics, lifetime value and cohorts, Subscribe & Save, and market share.
Because it does a bigger job. HelloProfit prices dashboards; My Real Profit prices the full analytics cycle, true P&L, customer economics, market share and advertising, plus a human data team reading it with you.
No. Setup is two clicks and the platform rebuilds your numbers automatically. Most sellers run both through the trial and compare the views before deciding.
Two clicks to connect Seller Central, then the platform builds your analytics automatically. No onboarding project, no credit card, and a 21-day free trial.
Yes. We connect through Amazon-approved access, your data is used only to build your analytics, and you can disconnect at any time.
Limited time deal

See your real numbers before you decide

  • 21-day free trial
  • Full access to every report and metric during the trial
  • Then 50% off your first month
Claim my offer and start my trial

Amazon-partner grade data. Cancel anytime.

Last updated July 2026. HelloProfit details are based on their public pricing and documentation at that date. Check their site for the latest.