










Triple Whale Alternative

Triple Whale Alternative with profit by ASIN and a new-to-brand P&L

Triple Whale tracks your online store. My Real Profit is built for Amazon: the fees Amazon actually charged, what each customer is worth over time, and your share of every keyword.

Built for CPG brands and agencies.

Test My Real Profit Now
  • Ranked #1 of 30+ Amazon tools, 2023 & 2025
  • 5-star on the Amazon Selling Partner Appstore
  • Trusted by 1,500+ Amazon brands
Best Seller in Deodorants
Salt & Stone

100%

NTB accuracy

3×

Faster Insights

Best Seller in Sea Vegetables
True Sea Moss

2×

Subscriber Growth

40%

NTB increase

Top agency
Trivium

100%

Auto Reporting

50hrs+

Saved

Best Seller in Home & Kitchen
CGK Linens

-18%

Wasted ad spend

10x

Decision Speed

Best Seller in Headbands
Kitsch

5hrs+

Saved Daily

100%

Profit Clarity

Best Seller in Energy Chews
Neuro

3×

Optimization

100%

Branded view

Top agency
TripleLine

100%

Centralized Data

5×

Reporting Speed

Best Seller in Cutting Boards
Royal Craft Wood

+13%

Gross margin

−22%

Refund reduction

Best Seller in Stick Umbrellas
UEP

4×

Efficiency Gain

100%

Cost Control

Head to head

My Real Profit vs Triple Whale

Where Triple Whale has a feature, it gets a check. Where it covers it only in part, it gets a dash.

My Real Profit
Triple Whale
Planning
Plan vs Actual (set targets & plan, track actuals) Triple Whale: forecasts in Moby, no targets
True profit & P&L
Live P&L, every Amazon fee reconciled Triple Whale: estimated Amazon fees
P&L by product and ASIN Triple Whale: profit only as an Amazon total
New-to-Brand/Repeat P&L
Profit calculator per unit
Market & search
Market share tracking
Search Query Performance (SQP) analytics
Brand CTR/CVR vs competitors
Customer & lifetime value
New-to-Brand vs repeat revenue split Triple Whale: returning-customer revenue only
Lifetime value & cohort analytics Triple Whale: cohorts for store data
Subscribe & Save analytics (real vs fake) Triple Whale: store subscriptions only
Advertising
Advanced advertising analytics by keyword, placement, search term, campaign, hour Triple Whale: campaigns and search queries
Break-even ACoS (LTV-aware)
Reporting depth
Daily business report (40+ KPIs, customizable)
Year-over-year & period comparisons Triple Whale: previous-period change only
Custom / customizable analytics
Operations, agencies & team
Inventory analytics Triple Whale: store inventory, not FBA
Agency client reporting & multi-user access
Dedicated human data team Triple Whale: Enterprise plan
AI
AI assistant on your data
Only in Triple Whale
Multi-channel ad attribution (pixel)
Shopify and paid-social analytics
Free plan My Real Profit: 21-day free trial, no card
Available
Not available
Partial

See your real numbers on your own account

  • 21-day free trial
  • Full access to every report and metric during the trial
Start your 21-day free trial

Amazon-partner grade data. Cancel anytime.

Only in My Real Profit

Where My Real Profit goes further than Triple Whale

See your share of every keyword

See what share of searches, clicks and purchases you get on each keyword, from Amazon's Search Query Performance data. It also flags keywords where ads take orders you would get organically. Needs Brand Registry.

Market share & funnel 14.3% share
SQP By Week SQP By Keyword SQP By Parent SQP By Child Compare All SQP
Search Query Search Volume Purchases(Market) Purchases(Brand) Clicks(Brand)▾ Impress.Share % ClicksShare % ATCShare % PurchasesShare % PPC Spend ACoS
multivitamin 48,311 5,156 180 626 4.60% 3.14% 3.18% 3.49% $ 2,561 47.22%
vitamin c 120,532 11,963 174 578 1.31% 1.29% 1.41% 1.45% $ 1,499 38.07%
vitamin c 500mg 9,740 600 106 358 3.63% 13.86% 14.83% 17.67% $ 1,394 26.68%
vitamin c + d 28,956 2,556 119 315 2.62% 2.79% 3.54% 4.66% $ 809 77.26%
immune support 133,280 11,445 101 253 0.58% 0.47% 0.56% 0.88% $ 2,376 40.46%
vitamin d3 1,988 165 73 187 10.14% 24.28% 32.73% 44.24% $ 631 46.36%

Profit from new and repeat customers, separately

Your P&L split into new-to-brand and repeat customers, with ad spend charged to the new ones. You see which group actually brings the profit.

P&L · New to Brand vs Repeat 44.45% repeat margin
June 2026
New to Brand Repeat Total
Sales $134,650.19 $517,096.04 $651,746.23
Units Sold 4,931 19,183 24,114
-
Cost of Goods Sold $31,609.63 $115,568.98 $147,178.61
Cost of Goods Sold % 23.48% 22.35% 22.58%
-
Gross Profit $103,040.56 $401,527.06 $504,567.62
Gross Profit % 76.52% 77.65% 77.42%
-
Referral Fee $19,938.03 $74,782.58 $94,720.61
FBA Fee $20,159.79 $78,267.27 $98,427.06
Amazon Fees Total $40,097.82 $153,049.85 $193,147.67
Amazon Fees % 29.78% 29.60% 29.64%
-
PPC Advertising Spend $47,324.20 $47,324.20
Promotions / Coupons $1,717.75 $18,604.36 $20,322.11
Coupon Redemption Fees $666.29 $1,314.98 $1,981.27
Deal Fees
Total Marketing $49,041.95 $18,604.36 $67,646.31
Total Marketing % 36.42% 3.60% 10.38%
-
Profit From Sales $8,590.72 $229,872.85 $238,463.57
Profit from Sales Margin 6.38% 44.45% 36.59%

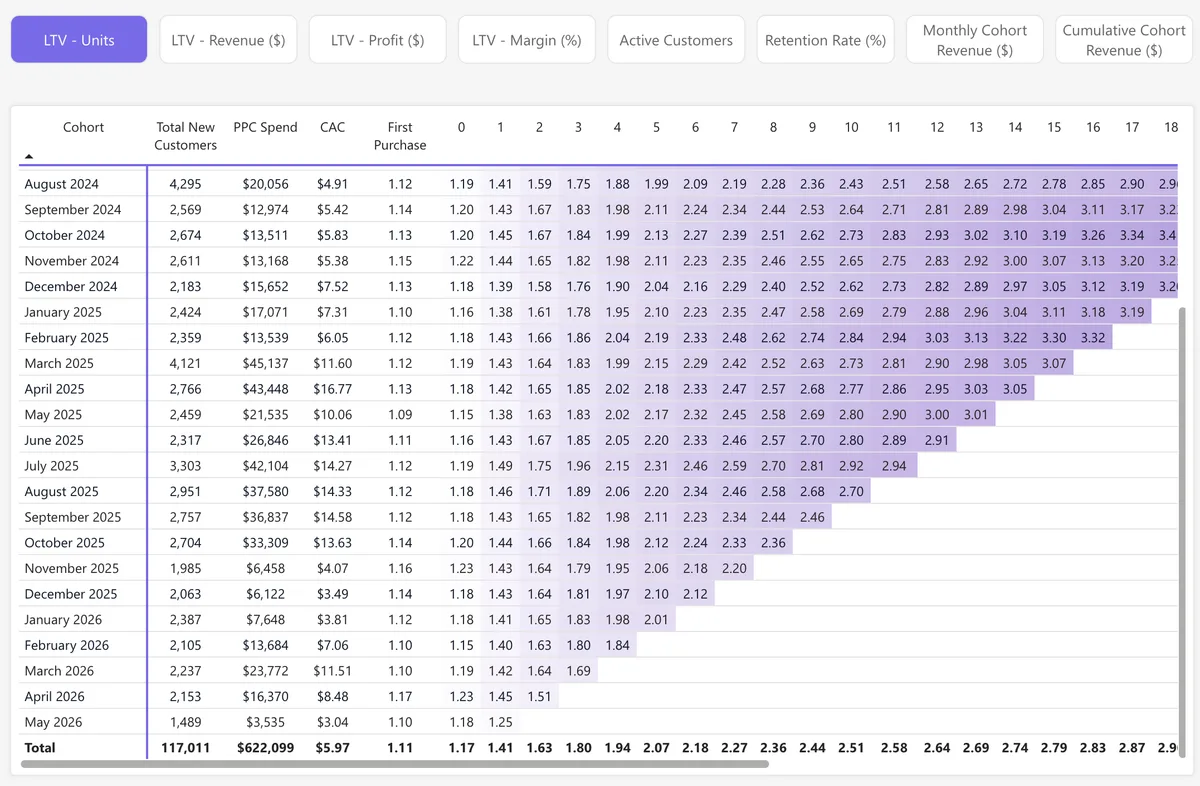
See when each month's customers pay back

Each monthly cohort shows retention, revenue and profit per customer, month by month. You see how long it takes to earn back what you paid to win them.

LTV by monthly cohort last 12 months
LTV - Units LTV - Revenue ($) LTV - Profit ($) LTV - Margin (%)
Cohort New Customers CAC 0123456789101112
July 2025 17,357 $15.97 1.16 1.27 1.40 1.52 1.62 1.71 1.79 1.86 1.93 2.00 2.06 2.12 2.13
August 2025 19,634 $17.19 1.14 1.25 1.39 1.51 1.61 1.70 1.79 1.87 1.94 2.02 2.09 2.10
September 2025 22,195 $18.30 1.14 1.25 1.38 1.49 1.59 1.67 1.77 1.84 1.92 1.99 2.00
October 2025 17,431 $16.38 1.17 1.27 1.40 1.53 1.62 1.71 1.80 1.88 1.96 1.97
November 2025 14,693 $15.62 1.14 1.24 1.37 1.48 1.59 1.68 1.77 1.86 1.87
December 2025 18,516 $16.62 1.11 1.21 1.34 1.47 1.57 1.67 1.78 1.79
January 2026 20,519 $13.94 1.10 1.20 1.33 1.46 1.56 1.66 1.68
February 2026 16,100 $13.95 1.09 1.20 1.34 1.46 1.58 1.59
March 2026 19,234 $14.18 1.10 1.20 1.34 1.48 1.49
April 2026 17,813 $15.06 1.10 1.20 1.36 1.38
May 2026 19,750 $15.11 1.11 1.22 1.25
June 2026 16,362 $14.49 1.14 1.15
Total 747,731 $10.82 1.14 1.27 1.43 1.56 1.68 1.78 1.88 1.97 2.05 2.12 2.19 2.25 2.31

Profit after every Amazon fee

Referral, FBA, promo and coupon fees go into one accrual P&L by ASIN. Estimates are replaced with what Amazon actually charged once it posts them; storage fees are still estimated.

Profit & Loss · accrual every fee reconciled
P&L lineJan 2026Feb 2026Mar 2026Apr 2026May 2026Jun 2026
Sales$1,254,267$952,789$878,926$927,998$1,552,262$1,560,734
Cost of Goods Sold$231,28018.44%$159,50616.74%$149,78217.04%$156,13216.82%$260,37816.77%$258,20616.54%
Amazon Fees Total$505,91340.34%$352,17636.96%$326,03437.09%$329,51435.51%$549,29935.39%$547,94735.11%
Refunds Costs$39,6373.16%$24,1352.53%$24,2502.76%$25,7302.77%$37,1682.39%$35,1732.25%
Marketing$192,58515.35%$170,43317.89%$132,85315.12%$79,9578.62%$186,48512.01%$217,29413.92%
Other / Adj. expenses$33,8732.70%$28,2012.96%$18,8202.14%$17,9291.93%$11,2070.72%$9,6340.62%
Profit$250,97920.01%$218,33822.92%$227,18725.85%$318,73634.35%$507,72532.71%$492,48031.55%

Try a new price before you change it

The Profit Calculator starts with your real costs from the last 30 days. Change the price, COGS or discount and see the new profit per unit and break-even ACoS.

Profit calculator · unit economics last 30 days of costs
Search by product name / SKU / ASIN Storage and refunds from the last 30 days
ProductSale priceFBA feeReferral feeCOGSStorageProfit / unitBreak-even ACoS
Solmera utility kit SKU: SLM-91FT-42C$33.55$9.6515%$5.03$4.53$0.05$14.2942.6%
Ravaro home set SKU: RVR-63ND-15K$30.99$3.3315%$4.65$4.50$0.02$18.4959.7%
Ostira flex tray SKU: OST-24JB-88M$25.39$3.5415%$3.81$5.00$0.05$12.9951.2%
Meriso compact rack SKU: MRS-57PL-03Q$19.49$3.5315%$2.92$5.42$0.05$7.5738.8%
Tavira storage hub SKU: TVR-80QM-27B$20.49$3.5415%$3.07$6.23$0.04$7.6137.1%

See why profit went up or down

Compare this month with last month or with the same month last year. A waterfall chart shows how much of the change came from sales, marketing and refunds.

P&L · Compare periods cause of difference
OverviewDetailedCompare PeriodsPeriodThis month vs same month last year
NameCurrentPrevious% change
Sales$950,609$1,001,736-5.10%
PPC cost$117,606$171,468-31.41%
Refund costs$15,332$15,627-1.89%
Storage fee$2,596$2,11822.57%
Profit$257,272$194,54732.24%
Cause of difference Increase Decrease
PreviousSalesMarketingRefundsStorageOtherCurrent
Previous$194.5K
Sales-$20.6K
Marketing+$57.8K
Refunds+$296
Storage-$478
Other+$25.6K
Current$257.3K

Track the month against your targets

Set targets for sales, spend and profit, and see actuals next to them as the month goes. If you fall behind, you see it mid-month, not after it ends.

Plan vs Actual on track

Total Sales

$1,399,177

vs Target: $1,438,960 (97.2%)

Units

83,106

vs Target: 66,979 (124.1%)

Marketing Spend

$215,748

vs Target: $0

Profit

$186,728

vs Target: —

Total Sales Units Marketing Spend Profit
Total Sales Target Total Sales Actual
$30K $40K $50K $60K $40.1K $37.4K $52.4K $37.8K $50.3K $41.3K $53.9K $37.8K $47.6K $37.8K $44.3K 01 02 03 04 05 06 07 08 09 10 11 12 13 14 15 16 17 18 19 20 21 22 23 24 25 26 27 28 29 30 31 May 2026

Compare your CTR and conversion with the market

For each search term, see your CTR and CVR next to the market average. It shows where shoppers drop off on your listing, so you know what to fix first.

Brand vs market · CTR and CVR keyword level
All SQPBrand vs MarketBy ParentCompare
Search QueryCTR (Brand)CTR (Market)CVR (Brand)CVR (Market)Funnel score
b complex energy support tablets0.97%1.79%9.4%12.6%Below (3.2 / 10)
vitamin d3 supplement for immune support2.45%1.82%14.1%11.7%Above (7.6 / 10)
iron supplement gentle on stomach0.50%1.56%8.8%13.0%Below (2.9 / 10)
multivitamin for women3.14%2.41%15.2%12.9%Above (8.1 / 10)
immune support gummies1.28%1.33%11.9%12.2%Even (5.2 / 10)

Find subscribers who never order twice

A Subscribe & Save sign-up counts as fake when no second order follows. You see what share of new subscribers are real, product by product.

S&S · Real vs fake 93.06% discount-only
All Sales | NTB / RepeatS&S vs RegularS&S | Real vs Fake
All S&S sales Real S&S sales Fake S&S % of all S&S
$10K $20K $30K 0% 50% 100% 93.06% 02/1503/0803/2904/1905/1005/31

See ad results by placement and hour

Break ad performance down by placement, search term, campaign and hour, with profit after fees and COGS. You also see which ASIN people bought after a click, even if it was not the one you advertised.

Advertising analytics by placement & hour
SalesCampaignsPlacements InsightsIntraday
PlacementImpressionsClicksSalesSpendAd profitNet ACoS
Sponsored Products5,904,93815,197$91,676$51,608-$8,76559.09%
Top of search2,318,2047,412$49,730$29,884-$6,14063.44%
Rest of search2,104,5514,988$25,109$13,662$1,14852.18%
Product pages1,482,1832,797$16,837$8,062$1,22745.60%
Sponsored Brands1,204,6103,118$18,942$9,470$41248.29%
Sponsored Display842,0041,905$8,571$5,610-$1,20469.13%

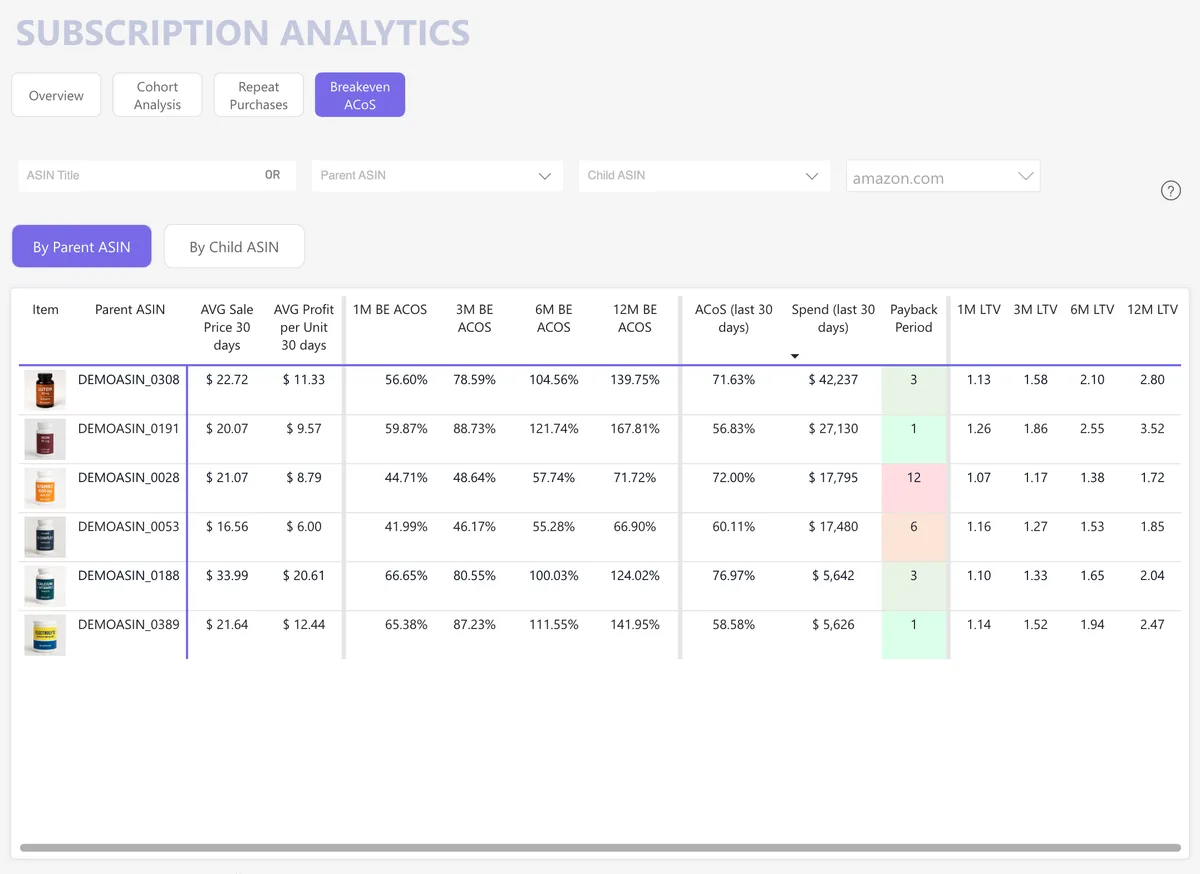
Set your ACoS limit from repeat purchases

Break-even ACoS for each ASIN, based on how often your customers buy again. Products with strong repeat sales can take higher bids and still make money.

Advertising · campaign profit LTV-aware
CampaignsKeywords & search terms Break-even ACoS (LTV-aware): 61.4%
CampaignSpendSalesAd profitAmz ACoSNet ACoS
All campaigns$ 36,712$ 75,099-$ 2,09448.88%51.32%
SP - Exact - Main Keywords - TOS$ 14,206$ 22,940-$ 2,41761.93%64.85%
SP - Exact - Brand Defense$ 2,914$ 18,760$ 3,18015.53%16.42%
SP - Broad - Discovery$ 6,481$ 9,742-$ 1,33866.53%69.71%
SP - Auto - Close Match$ 3,769$ 7,455-$ 20450.56%53.11%
SP - PT - Competitor ASINs$ 4,102$ 6,318-$ 90364.93%68.24%
SB - Exact - Category Terms - TOS$ 5,240$ 9,884-$ 41253.01%55.87%

Net ACoS is shaded against your break-even, so a campaign that looks expensive on first-order ACoS can still be profitable once lifetime value is counted.

Spot low stock before it runs out

FBA Inventory shows days of stock left and sales speed for each SKU, plus the ad campaigns still selling low-stock items. You decide whether to lower bids or keep going.

FBA inventory stock + margin
ProductSellableReservedPending inboundInventory valueUnits sold 30 dCover
Demo Product 0221 SKU: DEMOSKU_022129,2575,8200$177K19,61145 d
Demo Product 0152 SKU: DEMOSKU_015232,3309,63760$249K15,10064 d
Demo Product 0291 SKU: DEMOSKU_029150,31513,703133$471K14,990101 d
Demo Product 0458 SKU: DEMOSKU_045834,6445,58297$183K13,07179 d
Demo Product 0352 SKU: DEMOSKU_035211,5472,25520$67K11,81229 d
Demo Product 0406 SKU: DEMOSKU_040610,4891,6270$71K4,61068 d

Switching is painless

If Shopify is your main storefront, this is additive: keep Triple Whale for the DTC blend and add My Real Profit so the Amazon channel gets a true P&L and customer economics instead of a connector approximation.

Setup is two clicks and fully automated, with no contracts, no credit card, and a 21-day free trial for any company size.

FAQ

Questions brands ask before choosing between My Real Profit and Triple Whale

Not according to its help center. Its Amazon dashboard shows revenue and estimated fees by SKU, but profit only as one total for Amazon. My Real Profit shows profit by ASIN after product costs, Amazon fees, refunds and ads.
No. Its help center says it shows an estimated fee per product and does not import the fees Amazon actually charged. My Real Profit starts with the estimates and swaps in the real fees once Amazon posts them. Storage fees are still estimated.
No. Amazon does not allow pixels, so Triple Whale's attribution does not cover Amazon orders. My Real Profit uses Amazon's own ad data: how many days after a click people buy, and which ASIN they actually bought.
Triple Whale reads subscription apps on your store, such as Recharge, and does not list Amazon Subscribe & Save. My Real Profit shows Subscribe & Save orders and sales, and flags subscribers who never order a second time.
Yes. Triple Whale reads your store, pixel and ad accounts; My Real Profit reads Seller Central and Amazon Ads. They overlap very little, so you can keep both.

See your real numbers before you decide

  • 21-day free trial
  • Full access to every report and metric during the trial
Start your 21-day free trial

Amazon-partner grade data. Cancel anytime.

Last updated October 2026. Triple Whale details are based on their public pricing and documentation at that date. Check their site for the latest.